I have a couple of favorite breadth indicators which I use to determine when a bounce is imminent and sustainable. Neither indicator has reached the bounce threshold, but they are near.
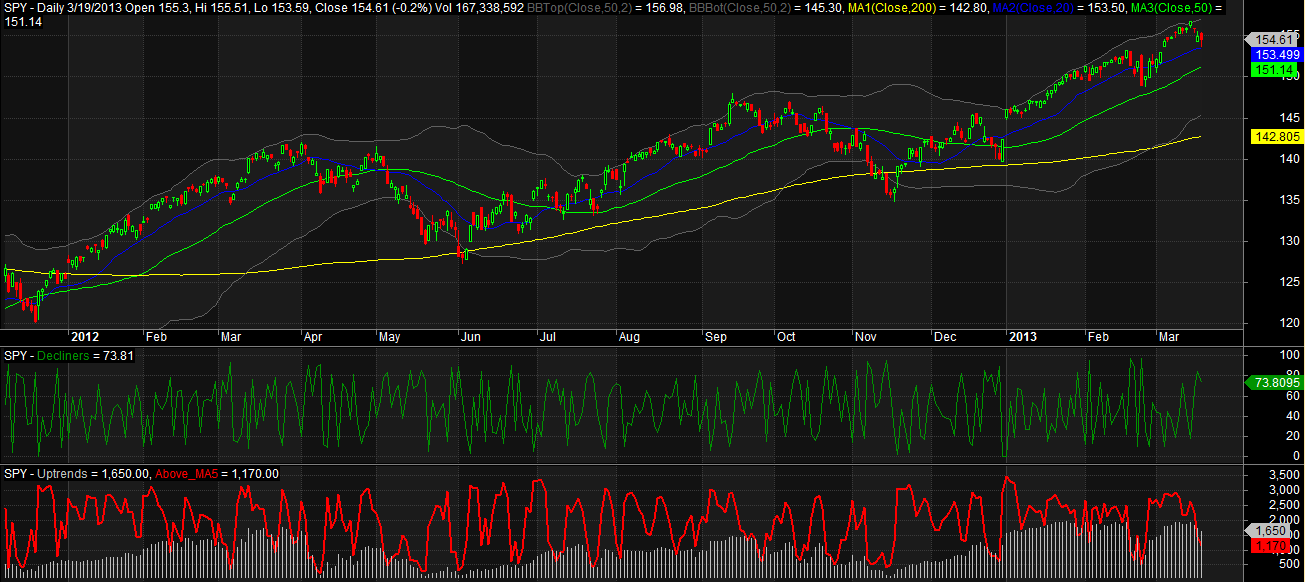
The main chart is $SPY with the major moving averages.
The middle pane, green line, is a percent ranked measure of the daily number of declining stocks. When this indicator gets above 80, I start looking for an immediate, typically next-day bounce. Ideally it is above 85 and nearing 90. These bounces may not last long unless the next indicator is also signalling a bounce.
The bottom pane, red line, is the number of stocks trading above their 5 day moving averages. It closed at 1,170. It needs to fall further to around 700 before I begin looking for a sustainable bounce. By sustainable I mean a bounce which should last for more than a day.
For now I do not see much of a short-term edge in terms of direction. Another moderately strong down day will likely trigger both of these indicators to signal a bounce.


Thanks for the work. Always nice to look at the aggregate numbers; individual stocks/commodities continue to grind sideways – failing to confirm anything to anyone and effectively keeping everyone on the sidelines. Right now time is running out, and all the market action that “has” to happen by May is on hold… When is the last time the markets failed to transition April/May?
Yeah, I’ve been looking for a weak April with the weakness starting in late March.