Friday’s volume surge was greater than 2.75 times the 50 day average volume. If we treat volume as an indicator, and ignore all other variables, what does a surge in volume portend for the short and intermediate terms?
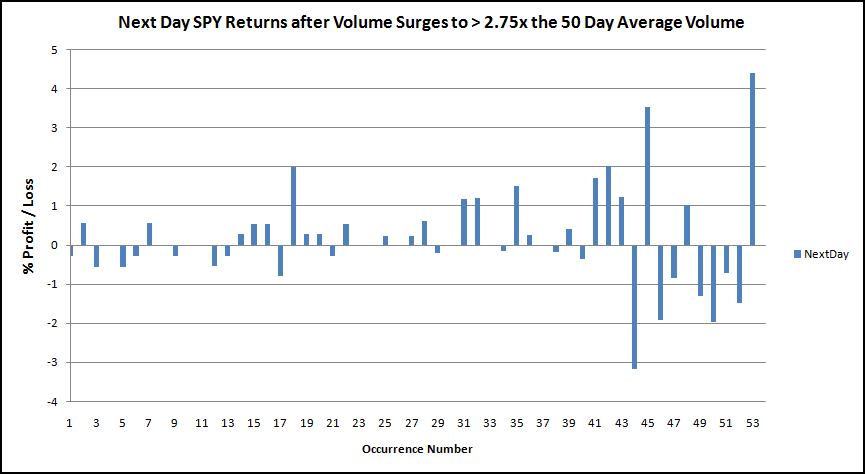
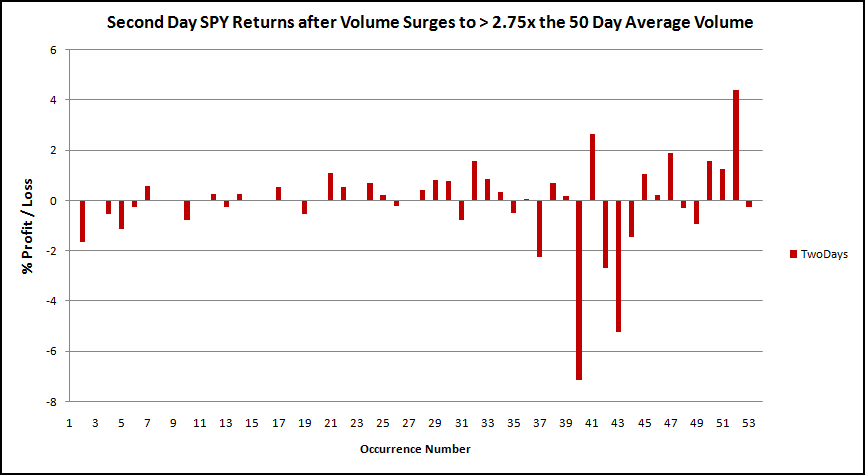
First, since everyone is concerned with the next several days, let’s look at next day, two day, and three day returns. To be clear, I have calculated returns this way: Two day returns is the return on day two after the volume surge. It is NOT the return of the first AND second day after the volume surge. The same calculation is used for the three day return.
Next Day Return
Average Next Day Return = 0.17%
% of Winners = 42.31%
Second Day Returns
Average Second Day Return = -o.08%
% of Winners = 55.10%
Average Third Day Return = 0.14%
% of Winners = 54.35%

Bottom Line:
What SPY does Monday, Tuesday, and Wednesday is hard to predict. History leans towards positive returns, but the edge is not strong. With the S&P downgrade, all analysis of the past might be meaningless.
What stands out is recent performance. Looking at the last 15 or so occurrences, note how volatile the market has become after a surge in volume. I suspect that if I dug deeper we would see that many volume surges occur during bear markets or downtrends, where we would expect a great increase in volatility. Volume just doesn’t seem to surge near tops or during uptrends the way it does during a downtrend or bear market phase.
There is an edge though, but it doesn’t show up in the short-term. It is very obvious in an intermediate term analysis. The chart below was generated by assuming one bought SPY at the close when the volume surged to greater than 2.75x the 50 day average volume. No commissions or slippage were included, and all SPY history was used.
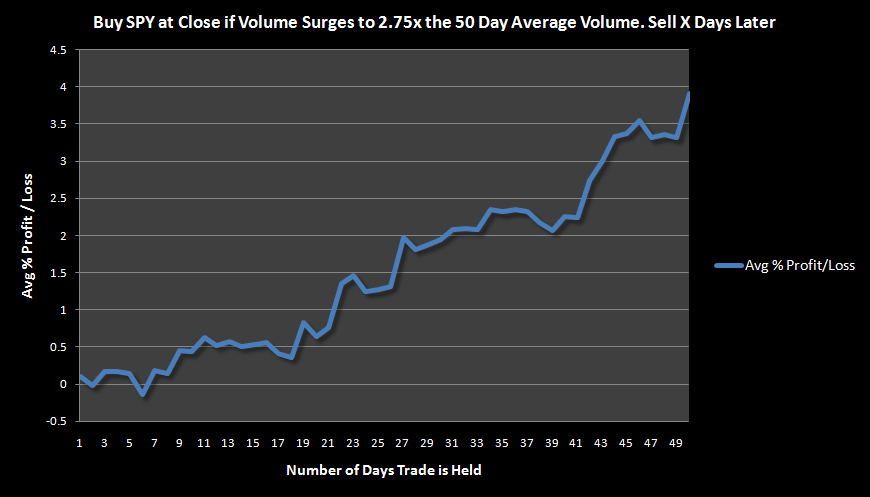
While we are living and trading during what seems to be an unprecedented time, in the past, large volume surges have led to a strong upside edge in the intermediate term.
It is important to remember that the chart above has combined all the trades to create an average. While the average is very bullish, we may find ourselves staring down a -4% to -8% move down over the next few days. I guess we should be optimistic and realize that we could also see a +5% upside move over the next few days. Since a bounce is due, I will go against my gut and lean towards the upside rather than more downside. Again, I’m using past data, absent an S&P downgrade of the credit rating of the United States of America.
Lastly, sustained bear markets are rare events. While they are few and far between, should the market be starting another bear phase, any bounce should be used to go to cash or initiate shorts.


Nice work. Much appreciated.
No problem. We must remember that most of the time, the market recovers fairly quickly from a sell-off. What we have to determine is if this time is different. I tend to think that it is different.
I see Jeremy has been fucking around on my blog, adding the thumbs up/down feature. I trust that my readers will use the feature judiciously.
nice post.
If 1168 holds, sell the 50% retracement back to 1250 and add shorts … 1250 could be the high for the next year or two.
I think a rally to 1280 is possible. We are very very oversold. However, if a rally doesn’t develop soon, I like the 1250 target.
From my experience, such heavy volume indicates capitulation which should be followed by a strong rally, but rarely are bottoms formed on high volume and so there usually is a retest on less volume
More on that later..
Btw, its hard to know when we have capitulation volume because the next days volume can always be larger (which means there was no capitulation yet)
If that makes any sense
That makes sense, although there haven’t been but a few times in history when volume at yesterday’s level was followed the next day by even larger volume.
Thanks Wood. Much appreciated.
Thanks Yogi. Glad to help. We certainly live in interesting times!
Hey Wood, sorry to butt in, since I am not familiar with all the players in this realm of non-fiction, but just tell me who this alleged ‘Jeremy’ is and I will terminate him w extreme prejudice. ANY sort of instant Popularity Poll is absolutely..
=> AND BEHOLD the first and only time I have ever used, to date, a no-no word on the internet…
FUCKING anathema to cold logical reason. The worst thing.
The investor does not give one USDA fuck about anything other than stating their view of truth plainly. Aloud if one is sharing, to oneself if not. Who cares who or how many people LIKE what they have to say? I will tell you who cares, the EGO cares. It tempers the tongue; it groupthinks the thought; the herd instinct, which is anathema, is stoked rather than abated and disciplined.
FEH!
A pox upon this mad lunatic who afflicts you, let me take off his head…
I do not care who likes what I have to say here, other than the host. I care not for man nor beast nor anything that gets in the way of my clarity. Hai! Get that crap off this noble site!
Daniel
Member, the ‘Defenders of Wood’
LMAO…Thanks! Daniel, do us all a favor and sign up to blog in the Peanut Gallery. I like how you think and write!
Thanks for the affirm, Wood. THAT is exactly how one shows they liked or disliked something, plus there are smile icons. Popularity polls of any kind go strait to the inner child. WHY does anyone think contrarian investment is so hard? It SEEMS so simple. It’s bcs of how we are hardwired, psychogically. Don’t INVITE emotion in.
The contrarian gets along w Shaitan, w God, w man, w anyone and everything in its season, but EGO is the arch enemy of the contrarian. To WORK the method must always make someone, including oneself, UNEASY and one never likes that.
Nuff said. I’m serious as a heart attack about this. Approval for good work is one thing, but an instant “here here” like at a tavern can squelch contrarian thought like nothing else. Nuke the damn colored thumbs!
Hai.
Wouldn’t it make more sense to examine volume surges within a range around the actual surge, such as 2.5x-3.0x, instead of only surges greater than the recent surge? This would make sense if the question is in reference to Friday’s action. If the goal is to examine extreme volume surges in general, the > 2.75x condition may make sense, but I’d then leave out any attempt to connect the results to today’s market.
Erik, not sure I understand. If the intent is to determine what happens after extreme volume surges such as the one we saw on Friday, then why wouldn’t I model Friday’s surge as close as possible?
Let me re-phrase with an example. You’ve excluded surges of 2.74x from your analysis, but included surges of 5x. A snap judgement (I have not analyzed this data myself) makes me think that a 2.74x surge is more likely to be be relevant in analyzing a 2.75x surge. Setting the analysis range to 2.5x-3.0x would include 2.74x, but ignore 5x, which seems to be a more closely related range of values to analyze. Setting the condition to >2.75x only counts instances *more* extreme than the current case, not cases “similarly” extreme. Those >2.75x extremes are a perfectly reasonable thing to analyze, but IMO, the condition makes this a look at extreme surges in general, and makes applying the results to this week’s market a little less appropriate. [I do enjoy reading your posts, so keep it up!]
Erik, I understand. Good point. Sometimes I do use a range of values (although I hadn’t thought about limiting the top of the range to exclude extremes), typically when the sample sizes are small. Since there were over 50 samples just using >2.75x, I didn’t adjust it. I will probably adjust to using a range in future tests as I think you are correct.