The Power Dip system is a long-only, dip-buying, swing-trading system.
I will be posting all of the backtest-generated historical results for the Power Dip system from 1/1/1990 to 9/18/2009. In a follow-up post I will post the backtested results up to May, 2009, and then we can compare those results to the out-of-sample, real-time results documented on the blog over the past 5 months.
The Power Dip trades will soon be available for subscription and will therefore no longer be published on the blog once the service goes live. Subscribers will have available their own community forum as well as help from me.
Backtest Specifics…
- Buys and sells only on the open using market orders (more about selling on the close, later).
- Uses a 10% stop-loss.
- Uses percent-risk position-sizing.
- Holds a maximum of 10 positions.
- When there are more trades than open spots in the portfolio, a proprietary ranking mechanism is used.¹
- Stocks must be priced greater than $1.00
- Stocks must have a 10 day average volume of greater than 300,000 shares.
- Commissions of .008/share are included. .008/share was derived from tracking actual commissions from Tradestation over the last 5 months.
Database Specifics…
The database is from Norgate, and has been filtered to include only major exchange listed stocks (no OTCBB). The database does not contain de-listed stocks.
Software…
I used AmiBroker to backtest this strategy. All of the graphs and charts, except for the Excel spreadsheet, were generated within AmiBroker. I highly recommend AmiBroker. In a word, it is awesome.
Results…
Click on the charts to enlarge them.

The metrics I feel are the most important are colored in white.
I want to highlight a few details:
- Exposure of 42% is low enough that capital could be used with another non-correlated system to achieve greater returns.
- A return on cash is not included.
- Risk-free rate to generate the Sharpe ratio is 3%.
- Metrics include commissions, but not slippage. Real-time tracking of slippage over the past 5 months has shown it not to be a major concern. In fact, the system may be achieving positive slippage due to the fact that each trade is mean-reverting.
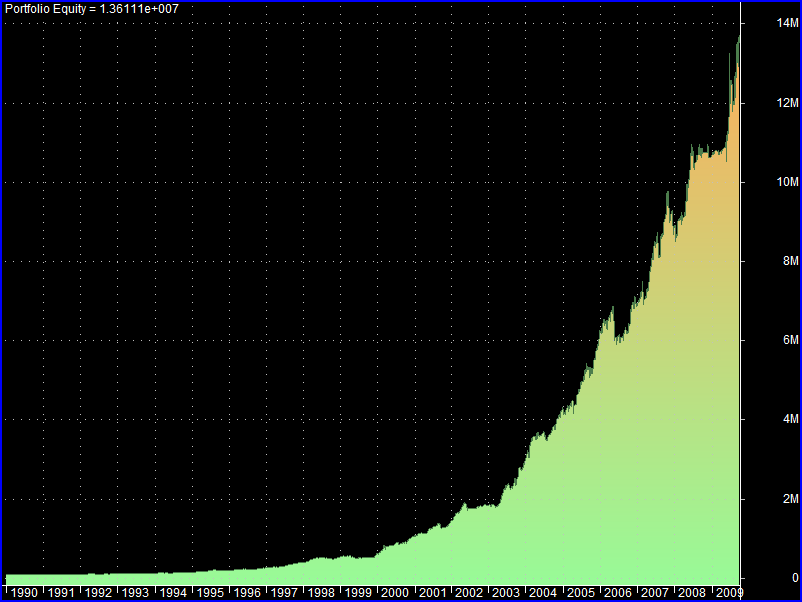
Equity Curves, Drawdowns, and Profit Table…

A linear equity curve is above.

A log equity curve is above. When the curve is green only, the system was 100% in cash. A curve that is blue only means the system was 100% invested.

A graph of the drawdowns is above.

A graph of the trade distributions is above. Note the big red bar on the left. That is the result of trades that were stopped out at ~10%. On average, 11% of trades are stopped out.

A profit table is above. Note that the system achieves positive returns in bear and bull markets, and has only had 1 negative year: 1990.
Summary:
The Power Dip system is the epitome of buying low and selling higher. It mimics the ebb and flow of the market, using all equity available during times of bullish trading while scaling back positions during bearish conditions. It has been a consistent winner during a variety of market environments.
I will be happy to answer any questions in the comments section concerning the Power Dip or the backtest methodology, or via email: woodshedder_blogspot at yahoo dot com. Don’t forget the underscore!
¹Thanks to David Varadi at CSS Analytics for suggesting a better ranking mechanism. His suggestion added approximately 3% to the compounded annual growth rate.


Wood, this is outstanding! I’m glad I asked.
Thx!
Thanks Toptick.
Closing the trades at the close rather than the open adds another 5% to the CAGR. Since I can only trade it using the open, I haven’t mentioned to much about that.
We hope to have the site for this system set up so that subscribers will have an exit target price the night before, so they can close trades at the next day’s close, assuming the target price is exceeded.
what an incredible system.
Will it be available in the PPT or as an additional service?
additional
Oh come on, Fly just include it
Don’t be a cheap motherfucker
Mrs Fly would not approve
How is Wood to be compensated for his hard work? Maybe I can mail him a few candy bars?
How about a new banjo and a case of Budweiser?
Good point,
That’s too bad, it would have made for a good Fly Show Infomercial
‘but that’s not all, register online in the next 15 mins and receive Woodshedder’s System Trading absolutely free!!!’
How much will it cost per month?
Looks good Wood – one question – what’s the average position size when you get to the end of the backtest? With only 10 positions, does size become an issue?
Absolutely. If one is trading with 14 million, divided between 10 positions, then the liquidity/volume requirement would be a big issue.
Maybe I’m making a bad assumption, but I’m not expecting a lot of folks with 7 figure accounts to subscribe and then dump all 7 figures into one strategy, across only 10 positions.
I chose 10 positions because 10 is not too much to manage yet still offers plenty opportunity. Speaking from the experience of someone who works full time, managing 20 positions takes some time every evening.
But I have tested using more positions. Moving up the max positions to 20 drops the CAGR to 16.60% and lowers the drawdown to 11.30%
In order to use 20 positions, the entry requirements would need to be relaxed, to provide more opportunity, which would probably bring results more in line with 10 positions.
Keep in mind with 20 positions, each position is sized half as small as with 10 positions, so if there are times when the portfolio is not full, less than optimum risk is being assumed, which of course impact performance.
With 20 positions, the average trade is still .99%, compared to 1.06% with 10 positions. The decrease in performance can then be attributed to the decrease in amount risked (.5% compared to 1%) on each trade.
Goodonya, Wood.
__________
In most years there has been One good month. Take that out, and performance would dip quite a bit. For a mean reverting system, thats a bit surprising. Also, whats your take on the low Sharpe Ratio.
Also, what is the likely result without compounding the capital.
We could take a lot of things out and see the performance dip quite a bit. I don’t see that “in most years there is only one good month.” I do however see many years where there were several good months. Your statement, “For a mean reverting system, that’s a bit surprising” is vague. I’m not aware of any research that shows a MR system to generate more stable monthly returns than other systems.
Re: the Sharpe ratio. The Sharpe for the S&P is typically near .40, which means this system almost triples it. I don’t consider that low. Also, the Sharpe ratio penalizes upside volatility equally as much as downside volatility. As you can see from the equity curve, this system generates a great deal of upside volatility. Because of this, it is penalized by the Sharpe ratio, even though upside volatility means larger profits.
Why would you NOT compound capital?
We don’t need to speculate what the “likely result” is. We can just test it, using a static position size of 10K. The majority of the metrics stay the same, as we would expect. An average trade of 1.06% stays the same regardless of position size or compounding.
Without compounding, CAGR is 9.58%, which still kills buy and hold. Without compounding, the largest drawdown over the past 10 years is 4% (Tiny, lol).
While we are considering tweaks (believe me, I have considered many, many tweaks over the past year of trading this system), how about not using stops (which I am vehemently against)? However, someone will surely ask about not using them.
Without stops, CAGR jumps 10 percentage points to 38.14% while the max drawdown only increases 5%.
Average trade without stops is 1.45%.
Thanks Wood. Nice job. I especially enjoyed the posts about the system as it was developed, and being able to follow along with some trades.
Yogi, glad you enjoyed it. I’ve come to love it as a system over this year. With system trading, some will fit your personality and your style, some won’t. This one is a good fit for me.
All joking aside, it’s quite amazing that it performed well(that’s an understatement) during a secular bull and bear market.
My opinion has always been that no system works well all the time during all types of markets(flat, trending, etc). Applying the correct system to the right market type is what produces the gains.
TA, it should continue to hold up well during market downturns as it will drastically reduce the number of trades it takes. You can see in October of 2008 that it made 0 trades.
When the market turns, it will initially take a few lumps, but as any correction deepens, there will be fewer and fewer trades made.
Brava, sir and congratulations on finishing your work.
With the small stocks you are apparently using, the survivorship effect might be very heavy going back more than 2 – 3 years. Comments ?
How did you select the list of stocks that you use to find trades ?
Thanks
ebe
Eber, the system tests well requiring stocks priced more than 5 dollars, but with the small caps screaming this year, we lessened the requirement to 1 dollar to catch some of the large moves they are making.
I’ve done a good bit of thinking about survivorship bias. Here is my take…
1. This system is much more likely to buy stocks that are buyout candidates than those that are going bankrupt. I suspect that stocks that were bought (and therefore not in the database) would have a positive affect on the system as the Power Dip would have been buying their dips on the way to being bought out.
2. This system only buys stocks that are technically strong. They are much more likely to have made a new 52 week high, than be near any lows. Most stocks making new highs are not representative of companies going bankrupt. Again, this system will not buy dips in stocks that are making new lows.
3. It is possible that the system would buy the first dip on the company’s road to bankruptcy. That doesn’t mean that the trade would lose. It may stop out, it may be successful. But again, if the starts making lower highs and lower lows, it isn’t a candidate for the Power Dip.
The stocks are major exchange listed only, no OTCBB, with 10 day avg. volume requirement of 300K/day (as detailed in the body of the post).
I’ll be subscribing to this for sure. Seems like a great way to hedge 10-20% of my portfolio.
Good to hear it.
I would recommend allocating a portion of overall capital to the system.
Wood,
What % of total capital does it use for each trade? (e.g., 10% of capital is allocated for each trade)
congrats!
The way I recommend trading it is to use 10% stops with 10 max positions (meaning each position will get 10% of available capital), with each trade risking 1% of total equity.
This means that you would need to adjust your position size if you adjust your stop. If your stop is 12%, then your positions will actually get smaller to 8.33% to adjust for the larger stop.
One way to juice the system is tighten the stop to 8%, which means that you are now using 12% of equity on each trade. The larger position is nice to have when the system is outperforming. However, a streak of stopouts can be painful.
One can also adjust the percentage at risk up to 1.5 or even 2%. This would make your positions twice as large as before, but would allow only 5 max positions.
Anyway, this is the fun that is percent-risk positions sizing.
What would be the smallest starting capital you would recommend to be effective in utilizing this system?
Curiosity, I think that would have a lot to do with your brokerage and commission structure. Beyond that, this system trades pretty often, and it might trigger pattern daytrader status from time to time. Also, I do not recommend putting 100% of capital into one strategy. If you want to email and tell me your starting capital and commission structure, I’ll test it with those parameters to see what happens.
I would indeed be interested in discussing this further with you. What is your email address or preferred mode of contact?
Please ignore my previous post. I will contact you by email.
dear mr. woodshedder –
you said you traded it for a year – could you show us a sample portfolio of what you’re talking about ie kinds of stocks this system flags..- you don’t talk about sector exposure so curious what one might end up with as holdings…and if you could show us an example of a trade would be great…thanks and congrats..great stuff…
Mrs. Buttons, I’ve been trading it live on the blog since May. Almost every day I’ve posted the stocks the system flags 😉
Come back at 9:00a.m. and I’ll have a post up that will have the spreadsheet with all the trades since May.
As for sector exposure, whatever sector is hot, and pulling back, will usually make the screens.
There has been a distinct market shift from US based clients over the past few months and we see that trend continuing over the winter months of 2006 and on into 2007 has Sterling continues its increase in value over the US pound.