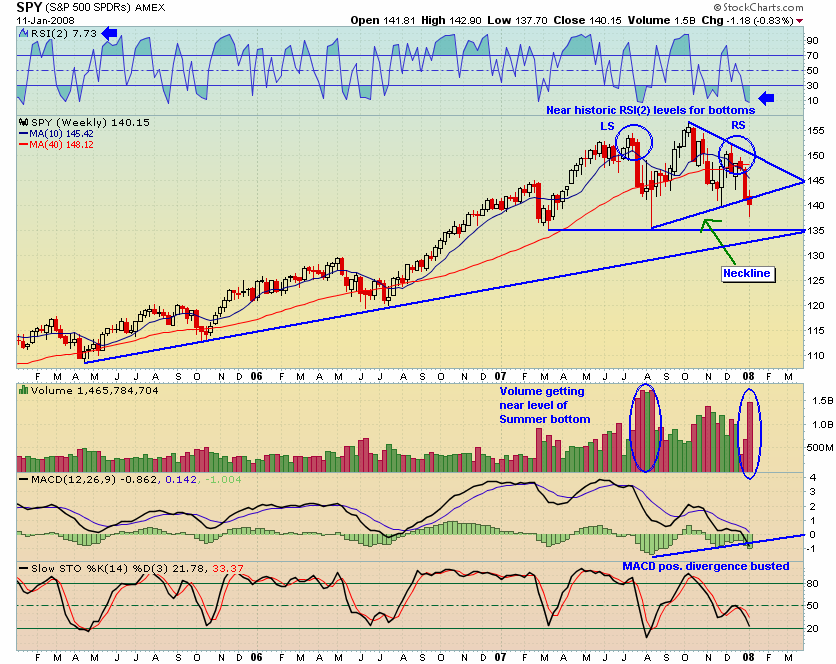
Take a look at this 3 year chart of the SPY. The exchange traded fund that tracks the S&P 500 broke through the neck line of a head and shoulders pattern last week. Interestingly, this neck line also forms the lower boundary of the triangle formation.
Looking at the 3 year trendline, 135 seems a given while lower 130s seem a modest target over the next month. I expect some support at 135.
Do note the Stochastics- over the 3 year trend, they stay overbought for months at a time, but tend to stay oversold for just a week or so. They are currently nearing a level which historically has produced tradeable bounces.
Also note the RSI(2) is approaching levels which have produced bounces, but these bounces tend to be shorter-lived on a weekly time frame than what is produced by the oversold Stochastics. Something that I’m starting to consider is that RSI(2) may bottom and begin going back up towards neutral before the market bounces. This makes sense as there need to be a number of stocks which have bottomed and begin going back up to produce a bounce across the indexes.


Interesting. Looks a lot like that Brasilia EWZ chart that recently went up on “Peanuts.”
Holy Charles M. Schulz, Batman!
thanks woodroe for the tech savvy – will u kindly keep us advised on SPY and as to when you think buying SDS S&P 500 (ultra short) may be a good idea or shorting the SPY if you prefer.
shed – where can i find that video of you playing guitar? is it on you tube? hit me at my email
I plugged in a few different moving averages, all showing a crossover. Thanks for the chart Wood.
Wood,
Can’t believe you were doubting yourself a month or so ago.
Now you’re like Leonardo DiCaprio with your arms out on the prow of the Titanic.
Only not so gay, and not about to be frozen to death.
Boomer- missed your comment somehow, I’ll send it to you.
Jake- I went through a bad spell there a few months ago. A break from trading regularly as well as realizing that overtrading was killing me gave me a big boost. Focus and conviction was what I needed.