The Death Cross is a technical signal given when a shorter term moving average dips below a longer term moving average. Investopedia defines it here: Death Cross. I typically see the Death Cross represented as a cross of the 50 day simple average underneath the 200 day. On a weekly chart, the equivalent moving averages would be the 10 and 40 week averages.
Simply put, a Death Cross means the intermediate trend has turned bearish.
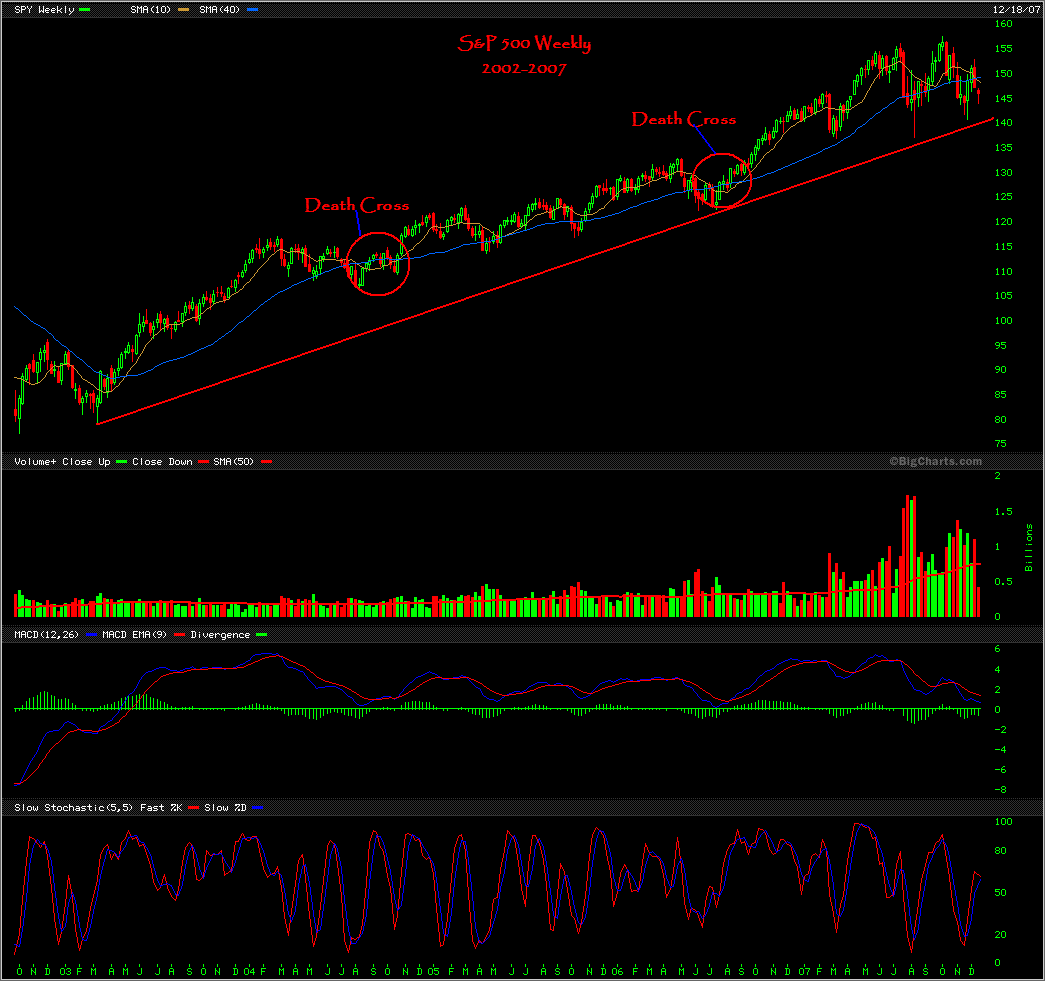
I decided to look back at the SPY and see how often this has occurred since the October 2002 bottom. As the chart shows, it has happened twice: Summer of 2004 and Summer of 2006.
It is important to note that the crossing of the 10 week average under the 40 week average, in both instances, marked the bottom, almost to the week.
Other interesting facts about the Death Cross on the SPY. From 1995 to 2000, there were only 2 crosses. One was in 1998, and the other marked the big top of 2000. The cross of 1998 was two weeks before the low was printed, and we all know that the cross of 2000 truly was a Death Cross.
The weekly SPY chart is already showing a Death Cross while the 1 year daily SPY will print a death cross within a week’s time, assuming the indexes do not rocket skyward.


Wood …. So the downside after the cross is somewhat limited, almost providing a buy signal other than in 2000, No? In 2000 was the neckline breached at some point that would have provided some warning that this cross was significant and not to be fucked with?
Yes, 3 of the 4 crosses of the last 12 years were huge buying opportunities.
Of course 1 of the 4 was a huge selling opportunity.
The tell-tale sign that I can discern is that if it is a bottom, price will overtake the shorter moving average within 2-3 weeks of the shorter average crossing under the longer average.
So for the chart posted, you’ll notice the price overtakes the 10 week moving average usually within 2 weeks of the death cross.
On the 2000 top, price did not overtake the 10 week average (on a closing basis) until 9 weeks after the cross. (Rough calculations: I’m just eyeing the chart).
No, no no.
Let me clarify what Wood is trying to say, without even realizing it.
THERE’S NO SUCH THING AS A “DEATH CROSS.”
Moreover, technical analysis is a waste of time. The equivalent of witch-craft in religion.
The way you’ve whined about having to knife people to survive after the 2000 top Fly, sure seems like there is a death cross.
Furthermore, we’ll see how good witch craft is vs. your time machine when the markets close Dec. 31st.
Death Cross is also a Norwegian black metal band.
Probably anyway… I have no documentation.
-DT