The fear, uncertainty, and doubt that is underlying the markets of late make it very hard to stay focused and disciplined (at least it does for me).
In order to keep my trades moving with the market, and not against it, I have created the above guide. I am also making one for the SPY and DIA, and will post them when they are completed. Maybe they will be helpful to some of you out there.
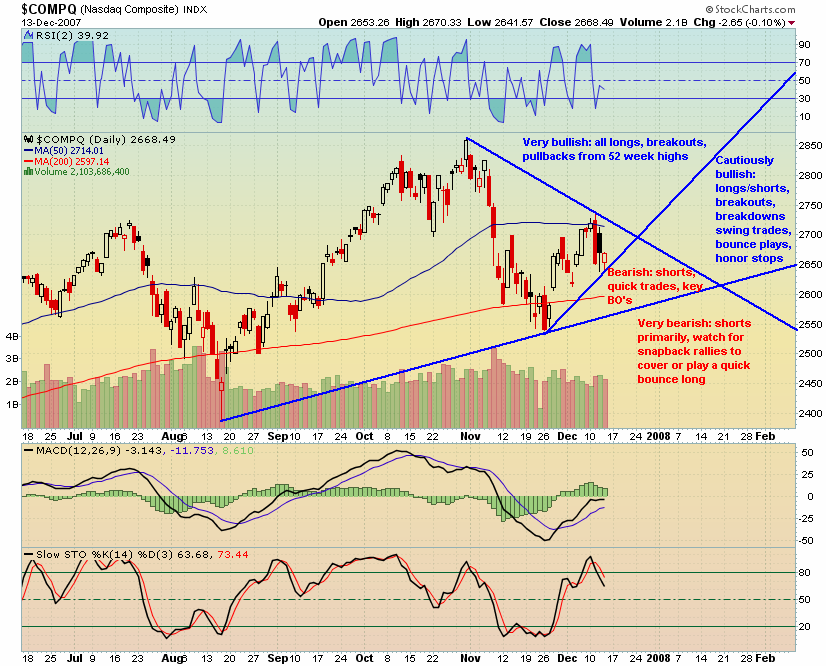
One note: The chart is not very clear about the support line drawn starting from the August low. Should the Comp trade beneath that line, I will be very bearish, even if the index stays above the recent downtrend line which begins at the October high.
One way to interpret this guide is to focus on the 4 quadrants. Currently, the market is in a neutral zone, but will soon break out of this zone and into 1 of 3 other quadrants. When that happens, I will plan my trades according to the guide.
Keep in mind that these lines are based on support and resistance, and are not “magical.” Therefore, there may be times when the index trades somewhat in between quadrants.


so, where are we now in your chart?
Uh, not sure if I understand your question. Today is the last candle on the chart.
I’m bearish and have been bearish or over a month.
However, the recent Fed cuts / auction announcements, and economic reports PPI/CPI, are likely to have pushed the market to breakout of the triangle, one way or the other. A break above the Oct. downtrend line will be bullish.
If the market doesn’t rally Friday or early next week, it will dash any hope of any kind of V bottom, and will be bearish. That action will break the most recent uptrend line, established after Thanksgiving.
I think I’ll buy some Apple in the morning but I have to ask Fly first or do you think that’s a bad idea since Fly has retired for the year and is probably only sitting around the house in his Smoking (like in jacket) and Ascott, sipping home made instant coffee from a Dunkin Donuts cup. Thanks for the chart.
The pattern still looks like an identical copy of what happened in August. Sharp downtrend, followed by a triangle, finishing with a breakout.
I can’t really think of anything that would make us behave different now…the economic conditions are just as bad, or perhaps a bit recovering? So I guess we just wait for that breakout, probably in the New Year.
I just played tic tac toe on your fucking chart.
thanks
LOL…did you win? Crosses or circles?
DPeezy- you just got your data that will make things behave differently now.
The breakout of the triangle will happen within 4 days.
Fly- fuck you, you quitter.
Hey Woodshedder,
Could you shed some light on why the market is still holding on to dear life even with the PPI and CPI up? Is this just one stubborn bull that doesn’t know when to die no matter how many times the matador stabs is sorry ass?
Raider- exactly. A 5 year bull run will not end overnight. There will be much gnashing of teeth. It will be more of a slow bleed than a swift crash, imo, of course. Again, watch your trendlines. The bulls will continually push the market back up to the line. This is normal.
Also, this is only one CPI/PPI data point. If next month it is again on the rise, look out below.
Finally, the gap fill is a powerful intraday play. I’m watching delayed quotes, but I bet that once the gap gets filled from this morning, it will be back down.
I hate conspiracy theories, but I firmly believe the Fed is injecting capital directly in the markets to allow an orderly decline.
Dpeezy, I see you were talking about a different triangle, and I agree with your assessment.
Raider- just a gap fill play today, nothing more.
Shed-
Is that a symmetrical triangle that is forming in GLD?
woody – are u gonna up-date yr chart every mkt day so we can follow the martkets demise and give us a better idea of when to go short and stay short with Inverse Etf’s?
bylo, sure.
thanks woodrow – by the way, what do u think the $CPC is signalling?