In a recent comments section, Employee8 asked about EMC. I’ve been keeping an eye on the chart, so I thought it would be a good time to get a look.
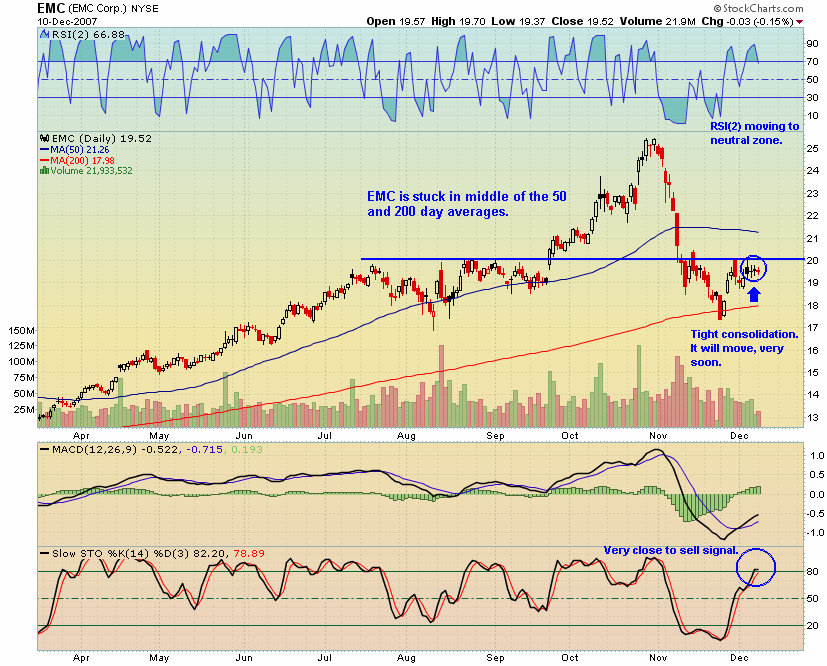
Surprisingly, EMC has been largely left behind by the large-cap technology rally. The stock has floundered beneath resistance at $20.00, but did bounce strongly from the 200 day moving average.
Overhead, the stock has the 38.2% Fibonacci retracement at $20.50 and the 50 day moving average at $21.00.
The very tight price action created during the last several days portends an imminent move. Should the Fed announcement launch a bullish surge in tech equities, I expect buyers to push the stock above immediate resistance at $20.00


Thanks Woody!
No problem.
Odd how this stock has not rallied lately.
Breaking it down to a 120 minute chart, an obvious reverse H&S pattern emerges with the neckline at $20. A break of the neckline on a bullish up move gives us a target of 22.60, which is near the 61.8% retracement from October highs to November lows.
Question is, is there any fundamental reason to this bullish move? It’s nice to have the technicals line up this way, but I like to see some fundamental reason to propel it higher so that it just doesn’t give us a false breakout.
Wood,
Nice call on ECA the other day. I have long since bailed with my targets being hit, but it continued to climb today.
Thanks. I’m still watching it too.
I’m running the RSI(2) screen right now.
vmw rocks more.
VMW chart is actually very similar over the last month as EMC. VWM looks like it is getting more attention than its parent.
ZIXI needs to be on watch lists. Also, ARTG and BIOS.
VMW up 3.85 while EMC up only .45 … stock price is about 5 to 1 so EMC s/b seeing +.75 to maintain that relationship but up against resistance now at 20.
@
Cool site. Thank you:-)
Good site. Thank you:-)