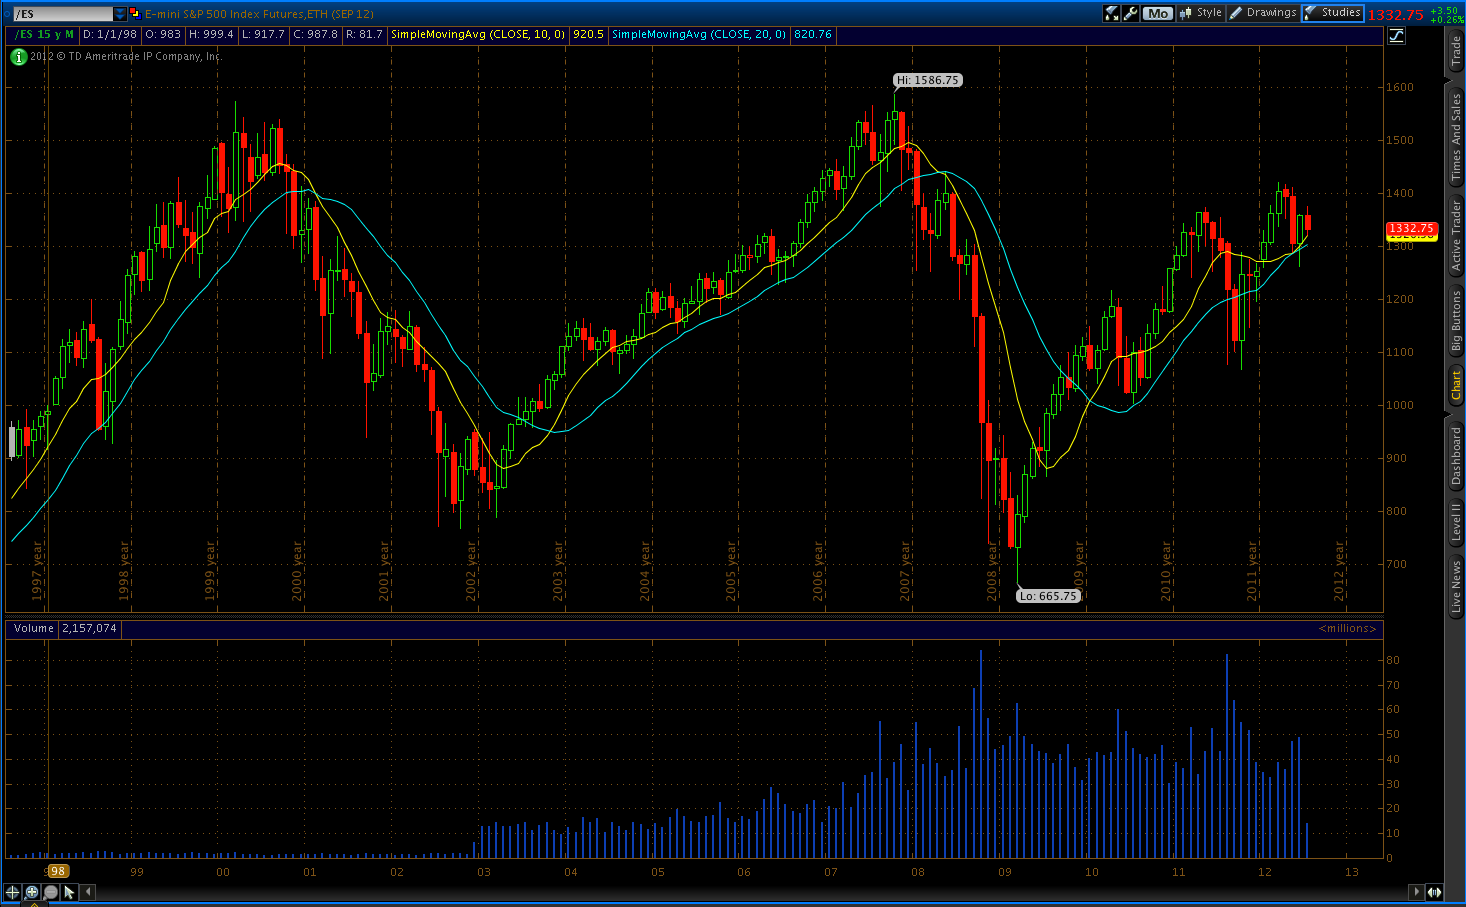
Since the March 2009 low of 666.79, the S&P 500 has had two corrections over 15%. We fell 17.074% from April 26th, 2010 to June 28th, 2010, and 21.58% from May 2nd, 2011 to October 4th, 2011. Draw a trend line connecting the last two highs immediately preceding those corrections, and we can see that the current price is close to bumping up against this resistance once again. I believe that sometime in the next month (as early as this week), the $SPX will tag 1687.41 (a BC 224% extended price target off an ABCD Harmonic pattern that completed at 1563.62), coordinating with this multi-year resistance line. These are the three possible scenarios I’m anticipating, in order of likelihood:
- We get a “summer top” at 1687.41, correct 5-7% then resume uptrend sometime in late-Q3/Q4 (price target 1766.35).
- We get a “summer top” at 1687.41, correct anywhere from 14-22%, then resume uptrend sometime in late-Q3/Q4 (price target 1776).
- We blast through resistance at 1687.41 and continue uptrend (price target 1776).
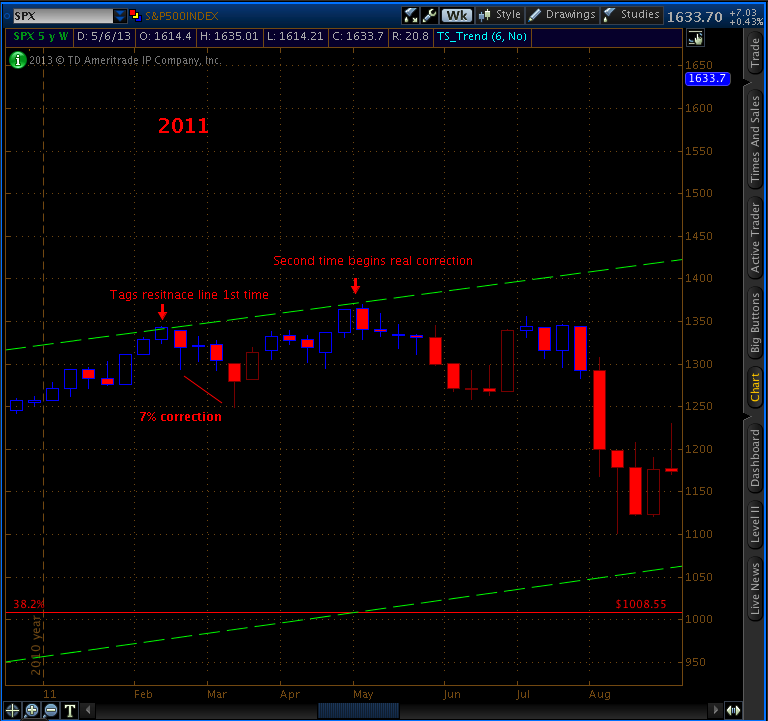
I believe the first scenario is by far the most likely. The last time we touched this overhead resistance in 2011, we first corrected 7%, then bounced back to make higher highs before finally rolling over 21%. This follows very common psychology at market tops. The last leg up in rallies is usually fueled by eager bears and weak longs who move aggressively on the first sell-off.
Here is what it looked like in 2011:
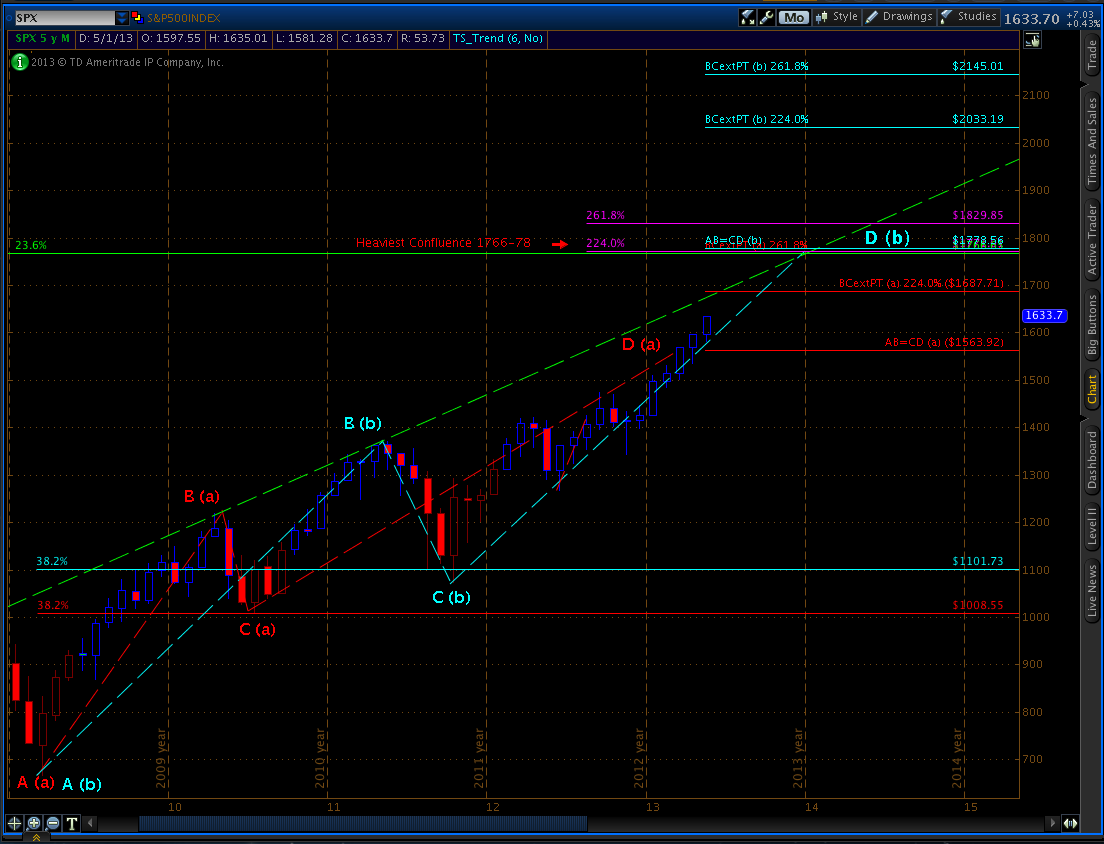
If this scenario does play out in a similar way, I expect us to find a bottom this summer around 1568-1600 (the scene of the multi-year break out to all-time highs), then resume the march north. I think 1766-1778 offers the greatest shot at our first 15%+ correction since 2011 (there will be an extended price target around 1830, but we need to see where we stall first to get an accurate price). The exact targets will change slightly as the actual prices print, so I will update these scenarios as necessary.
For context: The major ABCD Harmonic pattern $SPX is currently in has an extended price target of 2145. I don’t think there’s much chance of a “crash” (-40% or more) until we get to this level. I’m not saying we must crash at 2145, but this level offers a pretty good chance (see our post about the fundamentals of market tops in Bullish or Bearish: Conflicting Market Signals).
Originally posted by me, @freemrktcptlst, at TradingVega.com