Below are charts posted from a screen created. This screen first looks for stocks that have had a recent run up on a percentage basis and are now in a contraction phase. The contraction metric is either by a narrow percentage range or by Bollinger BandWidth. Also my goal here was to provide some not so common names (ie. popular HFT stocks). Below are some of the charts that the screen returned with the stock symbol and in parenthesis the Sector and Industry Group (via FinViz).
1) BRY (Basic Materials/Independent Oil & Gas) – broken downtrend, ADX starting to turn with a rising MACD

2) EXBD (Services/Management Services) – working off overbought conditions coming into a support area

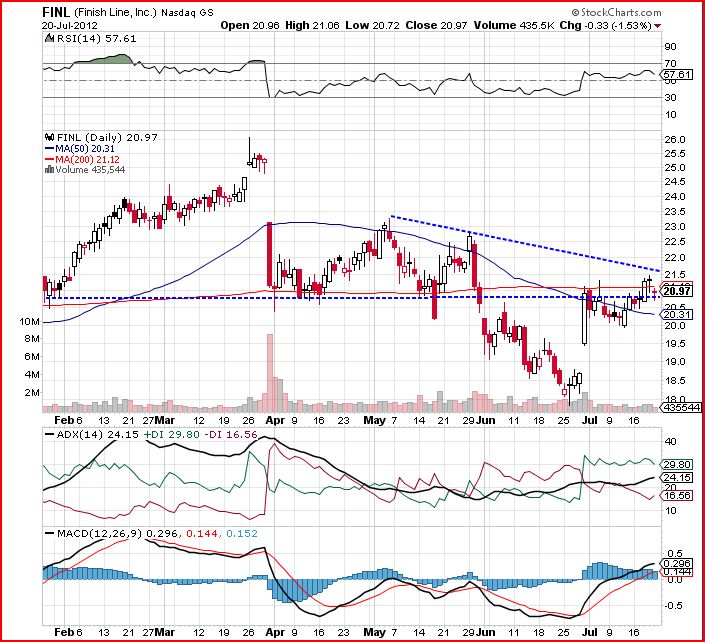
3) FINL (Services/Specialty Retail, Other) – broke out above long term downtrend line (not shown), looking to break shorter downtrend line, ADX trending up along with MACD line
4) HUB/B (Technology/Diversified Electronics) – long term chart shows possible diamond top formation, like the break out of range and holding above prior resistance

5) MSB (Financial/Diversified Investments) – just under trendline but tight base beneath, ADX turning up with a flat MACD line

6) SWN (Basic Materials/Independent Oil & Gas) – consolidating below longer term downtrend line (not shown) and 200 SMA.

Below is a list of all the stocks that were returned uploaded to FinViz:
Contraction by Percentage of Range
Contraction by Bollinger BandWidth


