Over the last year and a half, I did my best to give warning that the market was prepping for significant upside. I’ve been talking about 1998 style correlations in all asset classes, and they’ve all followed that outline in impeccable fashion. Most importantly, I shouted this info from the depths of major market volatility (August & February). I was so far ahead of this move that most of you have no clue what type of analysis and predictions were made on this blog. Most of you newer readers show up to wonder why the fuck I’m not blogging about what Hillary ate for breakfast or why Anthony Wiener’s wiener is in the news again.
While I see it’s become socially acceptable to participate in stocks again, you must keep in mind that this was a metric I mentioned that the market would impose on those that opted to raise cash rather than participate in one of the most incredible investment years I’ve ever seen. We saw stocks in the energy and materials space and the cheapest values they’ve ever seen. I’ve walked traders through some of the most epic long term entry points I’ve ever encountered in equities, and it seemed to have fallen on a crowd that slowly lost interest. Which is even better having been in the drivers seat with a message that proved to be right.
I’ve always likened this blog to Shawshank. I feel like Andy Dufresne – who crawled through a river of shit and came out clean on the other side. Lol.
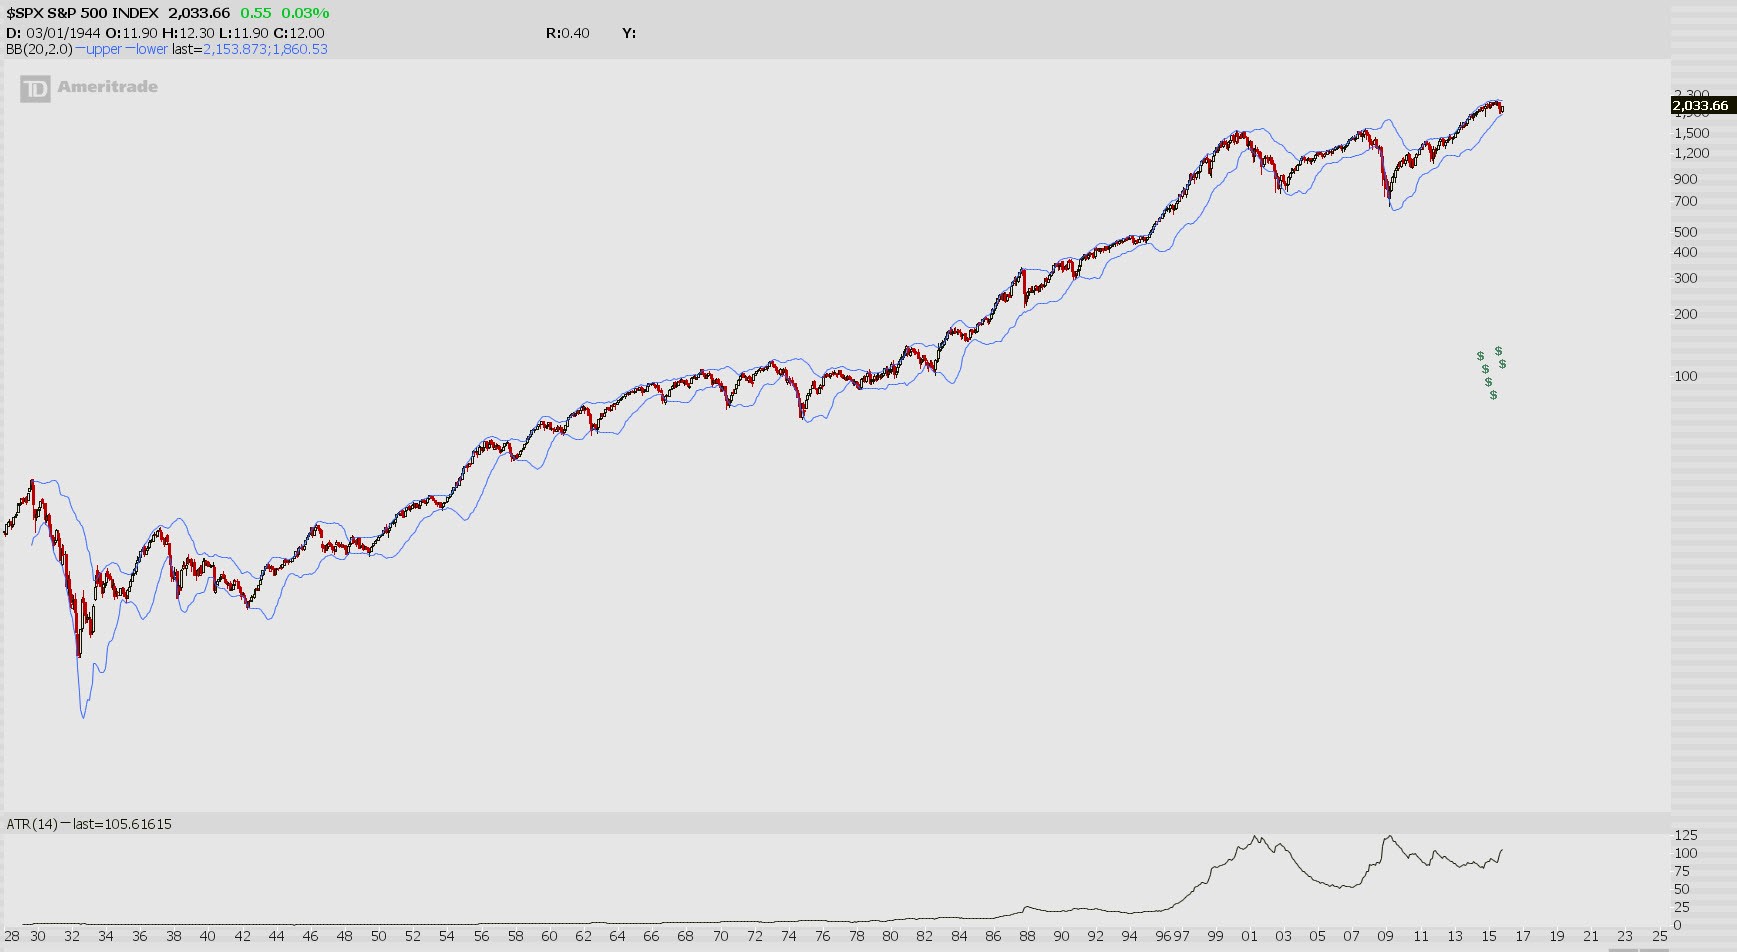
Anyway, remember my chart of the year this year?
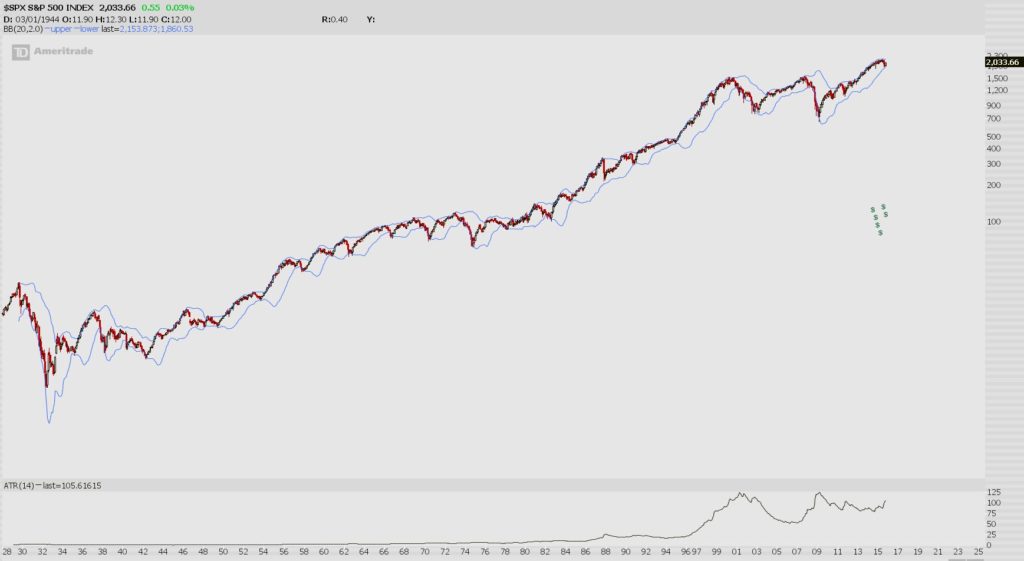
The volatility squeeze on the monthly chart. Combine that with the elevated cash levels held by Global Fund managers. Combine that with the horrific year for Hedge Funds and their overwhelming lack of performance. Don’t forget the year long redemptions in equities and hedge funds. The historic run of bearish sentiment, and two bearish sentiment extremes this year. The lack of interest and overall negativity in the public towards stocks. Now, the removal of uncertainty in the elections…coupled with the lack of a crash post Trump elect, which was guaranteed by so many professionals.
Folks, we’re now in a chase. Which, I told you would happen as far back as last year.
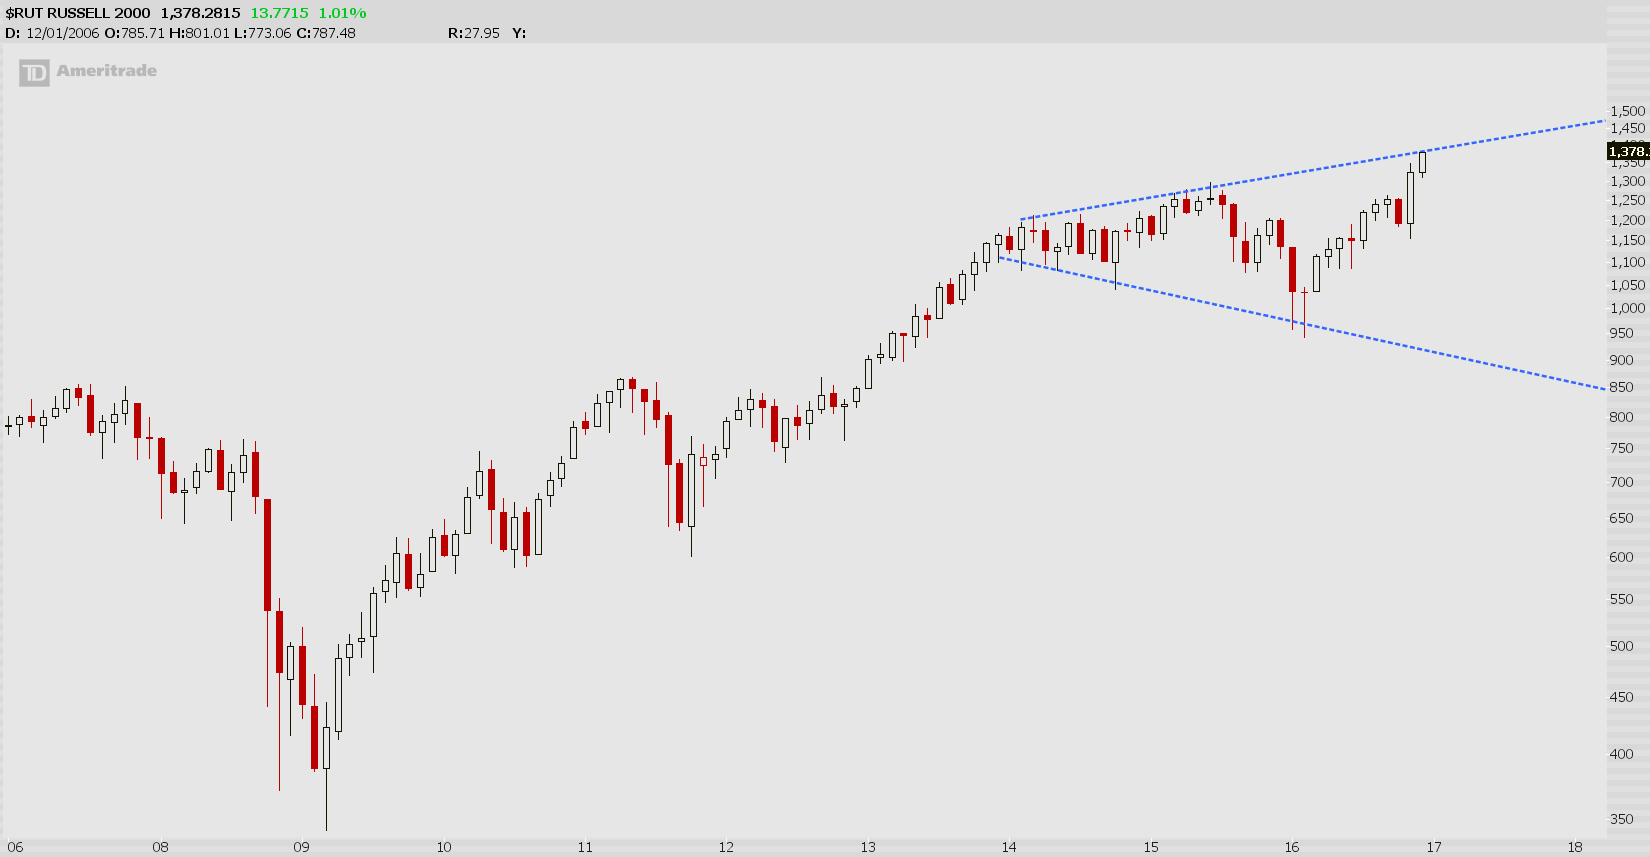
We’re already starting to see melt-up style movements in stocks. However, I am going to point out one more chart to watch. It’s a monthly chart of the Russell 2000. The Russell was the biggest beneficiary of a Trump win, with its amazing 15 day win streak that racked up a 16% gain.
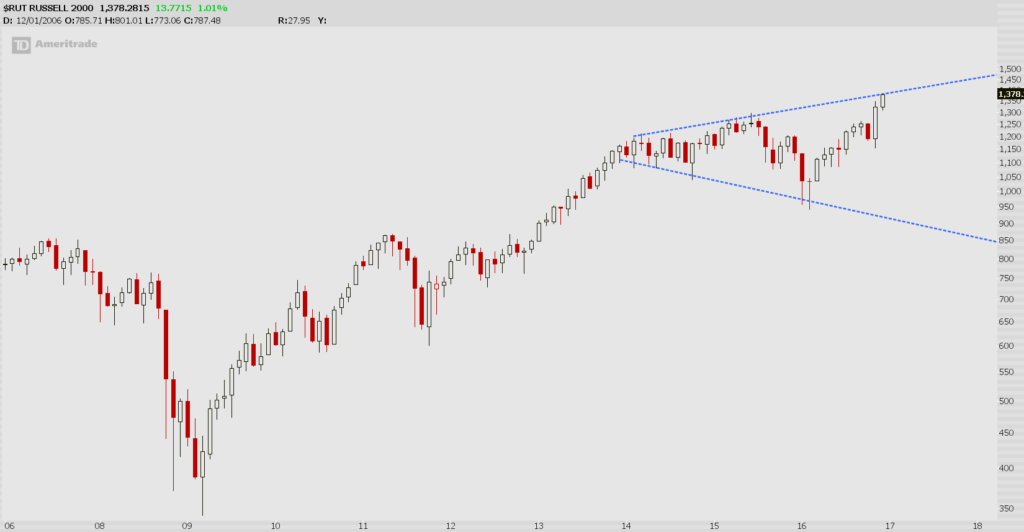
Last week, I diagrammed this same chart in the $COMPQ, which is breaking out today. While the daily NASDAQ composite suggests that 400 NASDAQ points be added from here, the monthly chart of the Russell calls for another 430 points of upside (+30%) should we break higher.
This is all on tap for next year my friends. Should you want to see what I have in mind to catch it? Grab a seat at my Boot Camp next week.
Comments »