In July of 2007, I began a model to track the advance decline line. The model is simple. Track each day the advance decline line of the NYSE and NASDAQ.
Then I use a 10 day moving average to trigger buy and sell signals. Currently, we have been in a sell signal. The 10 day moving average needs to move to +200 or greater on two days in a row. We are now there. As such, we move from cash to a buy.
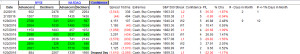
The model went to cash on January 8th at 1920.03 when we published on the 9th. We track in real time.
So a question that should be asked is how has the model done since 2007. The model tracks the S&P 500 and the returns are 118.13% versus the S&P 500 return of 176.02% so as a market timing tool it captured 67% of the upside.
Initially, the model was either buy or sell, i.e. short. In 2012, we added cash as a component. Since that point in time, there has been one sell signal that made money.
I use this model as one of several components of my market timing tools. The other tools have yet to tell me to dip my toe in the water and usually this is the first to do so. By the way, one of my models correlates almost 95% to The Fly’s buy model.
A key component of the model is it needs to start working within a couple days or the odds of failure are high.
Therefore, the rest of this week is key.
If you enjoy the content at iBankCoin, please follow us on Twitter


@Probucks, Told you that ABX / Gold Story has long legs. Only place of safety on Neg Interest Rates.