
Apple is trading down to around $460, post-earnings, as I write this tonight, down over 10%. I had previously discussed the monthly chart of Apple and how using a Logarithmic Scale instead of the common Arithmetic Scale was appropriate given the stock’s rapid appreciation over the past several years. That Logarithmic Scale on the monthly told the story not so much of a parabolic blow-off top, but rather of a secular bull run currently in correction.
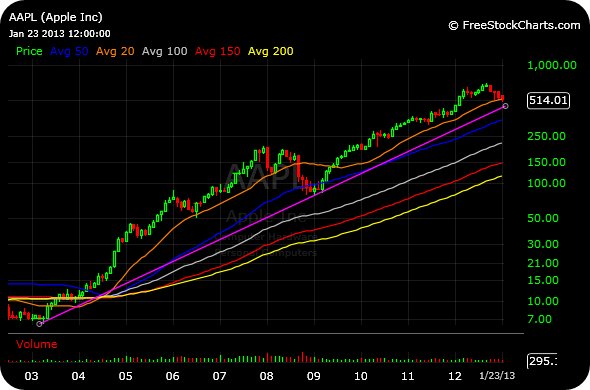
Obviously, that correction deepened this evening, which is another example of why I almost always take a pass on playing any stocks’s earnings, long or short. (That is just my style/philosophy, though–Some traders are incredibly good at gaming earnings). At any rate, updating the monthly chart below with the Logarithmic Scale, it certainly appears as though the major support trendline (purple line) since the 2003 bear market lows is likely to be tested soon. The trendline sits just below current price, at $450.
Keep in mind, Apple has been in correction for over four months now with very little in the way of a relief rally. The post-earnings selling after that four-month decline could easily be large fund liquidations and retail panic, often which signal at least an imminent tradable low.
____________________________


One comment
Pingback: The Best of iBankCoin This Week: 1/20/13-1/26/13 - Stock Picks and Discussion at iBankCoin | The Fly