iBankCoin
Joined Nov 29, 2008
329 Blog Posts

Rising Wedge Formation Nearing Stress Point

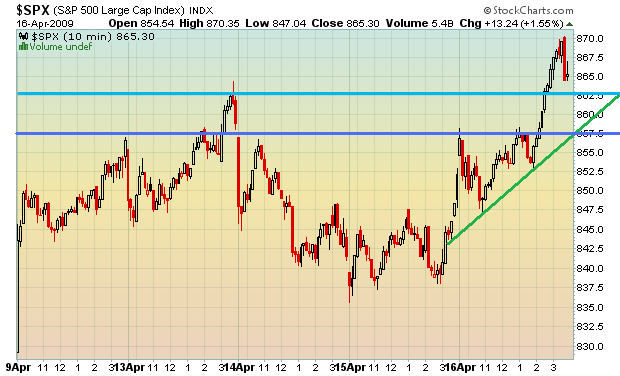
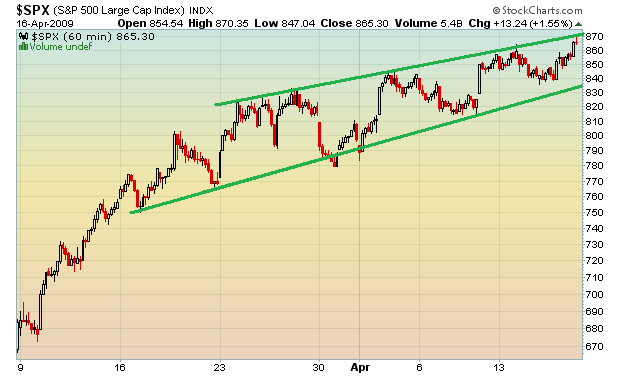
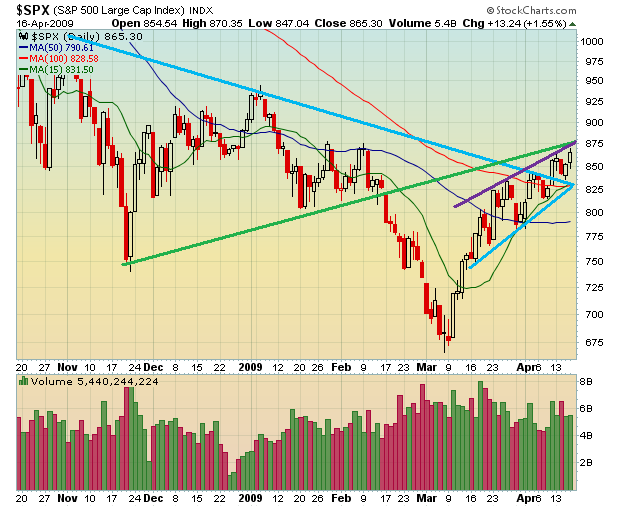
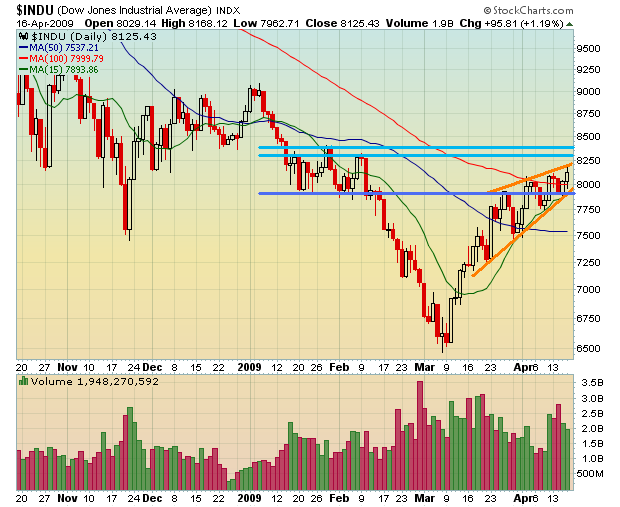
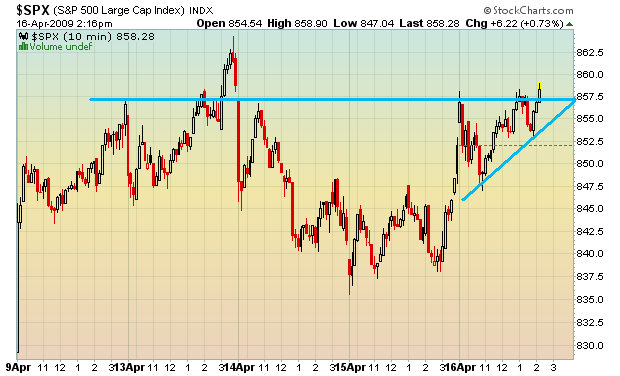
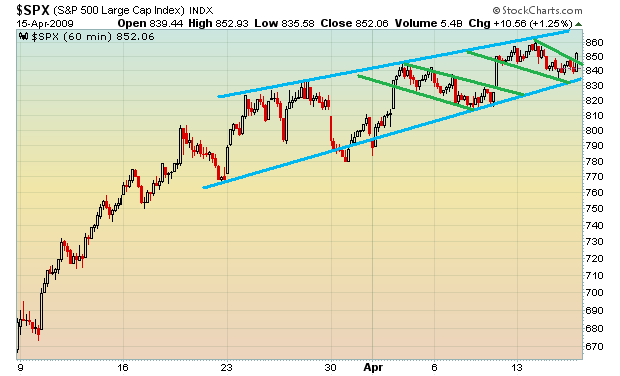
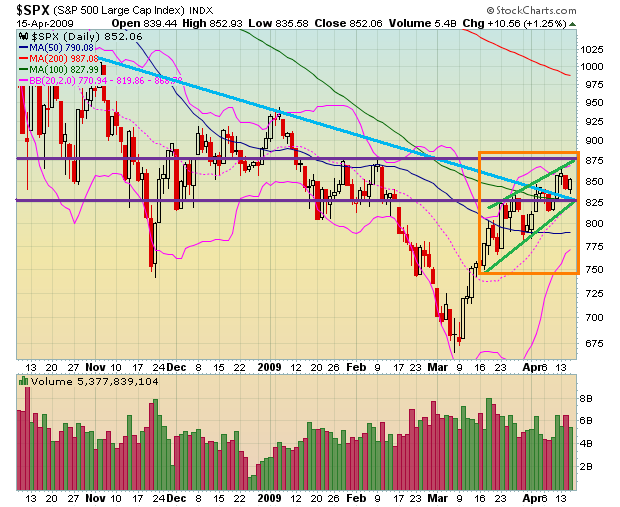
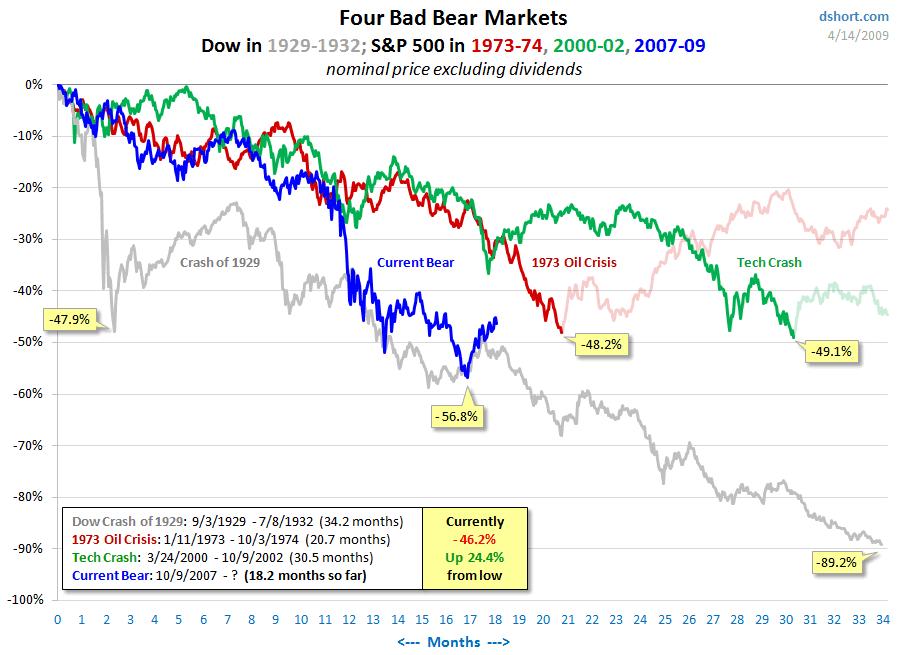
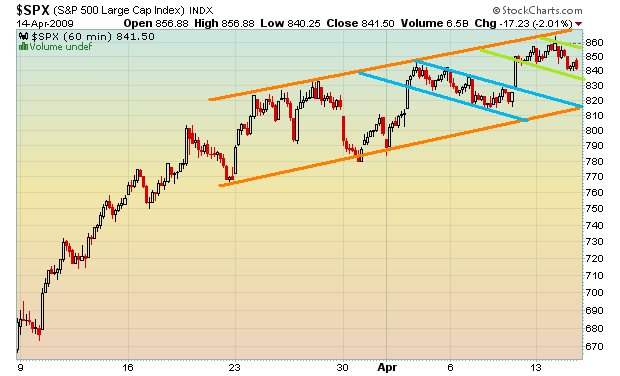
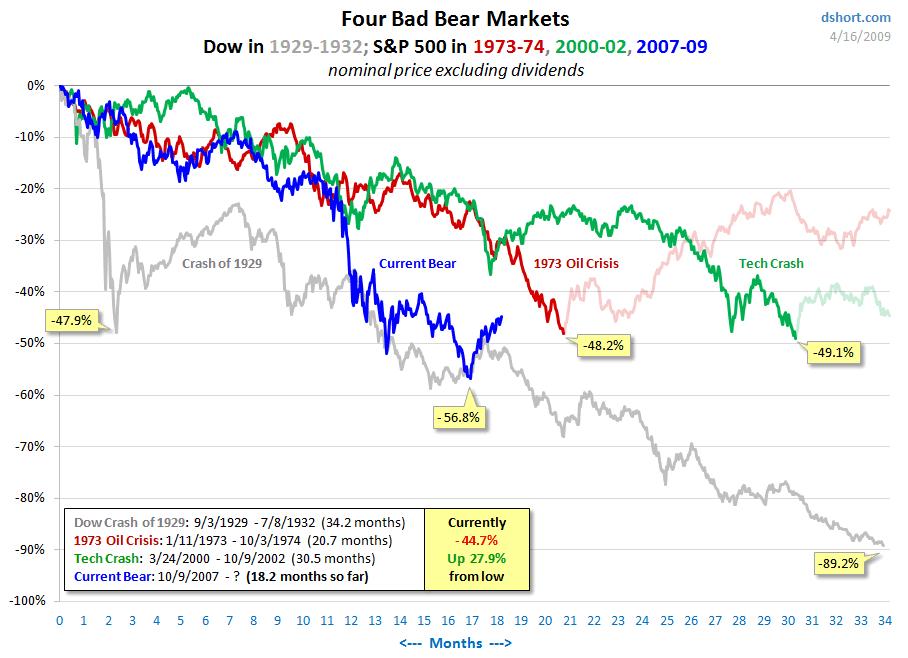
I won’t be able to gauge any levels until after all of the pre-market earnings are out of the way, but if needed, immediate support is located at approx. 858 SPX. If you look on the 40-day chart, you can clearly see the narrowing rising wedge. A major move is coming soon. Typically, in most cases, these patterns are bearish. Coupled with the fact that the market rallied 28% from it’s March low, it seems likely that we will start heading down sometime soon. All options are on the table.

Pre-market earnings: C, GE, FHN, MEG, STU, AOS. None matter more than C and GE, obviously. As for econ reports, we have only the U of Mich. Consumer Sentiment coming out at 9:55AM EST. Consensus is 58.5 with a range of 58.0 to 61.0, with a previous reading of 57.3.

The SPX is closing in on my near-term target of 875. Even though I am long, I grow uneasy as the wedge continues to take form.

Also, voting for the next tabbed blogger takes place at 9:00AM EST in The PPT (JakeGint vs. Cuervoslaugh). For a cost of $2, you’ll be able to see it’s all about. May the best man win. Goodluck Gentlemen.

Comments »
Rising 4 Method / Sup+Res / Econ+Earnings / VIX Breakdown

Today’s earnings and economic reports will move the market for sure. I say this because yesterday’s last hour spike helped create a Rising 4 Method. There are combinations for this pattern, such as the Rising 3, or 5, or 7 Methods, and they were prevalent enough to keep this rally alive. the Method is created using a long white candle, 2 minor distributional days, and another white candle to sandwich the pattern together.

For the reports, we have Housing Starts, Jobless Claims, and the Philly Fed. This first two come at 8:30AM EST and the latter comes at 10:00AM EST. The consensus for the starts is 0.570M with a range of 0.500 to 0.645M, with a previous reading of 0.583M. The consensus for the claims is 658K vs. the previous reading of 654K. Finally, economists expect the Philly Fed reading to come in at -30.2 with a range of -37.5 to -28.0, with a previous reading of -35. Their charts can be seen below:


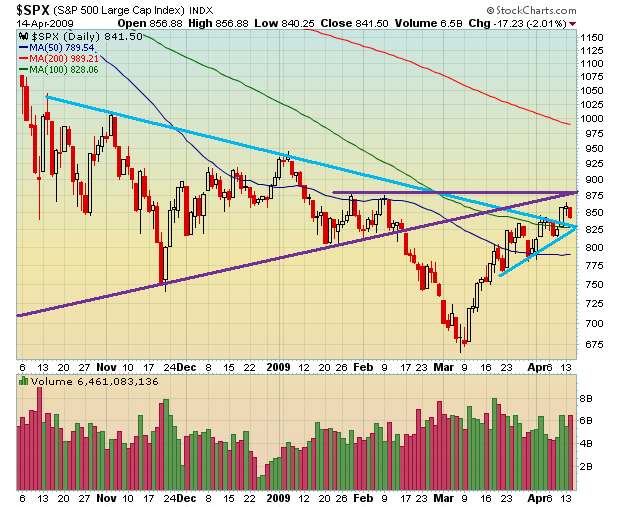
As for earnings, we have some notable ones coming out pre-market: BAX, FCS, GCI, HOG, ITW, JPM, KNL, NOK, SHW, SON, LUV, USAK, and UTEK. There are some big names in this bunch that will lead the market today. By looks of the chart alone, it appears that the market will head higher. If we do, it is important to note that the SPX is likely to get stopped at the upper bollinger at 868, provided it passes through some minor resistance levels. The rising wedge on the 6 month chart itself, is not a bullish pattern, but as you can see in the orange box drawn, there is enough support at the bottom of the Method.

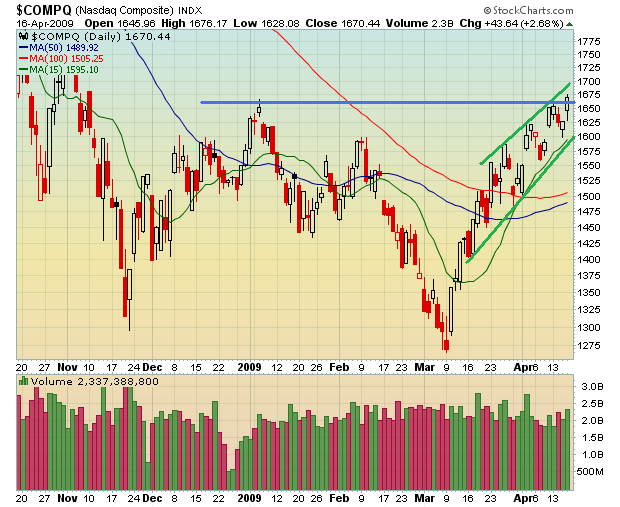
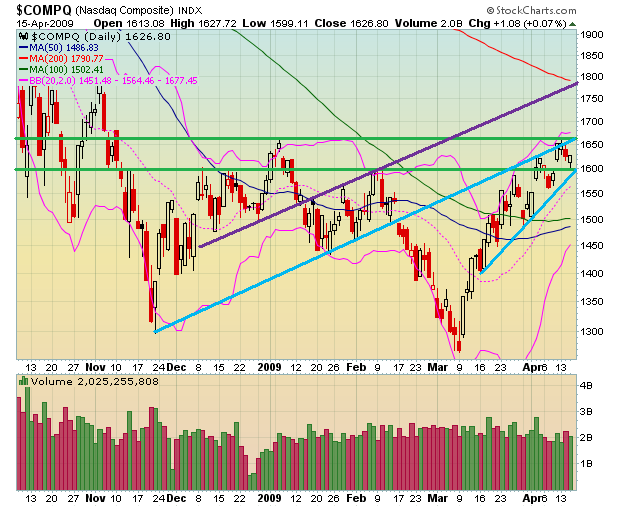
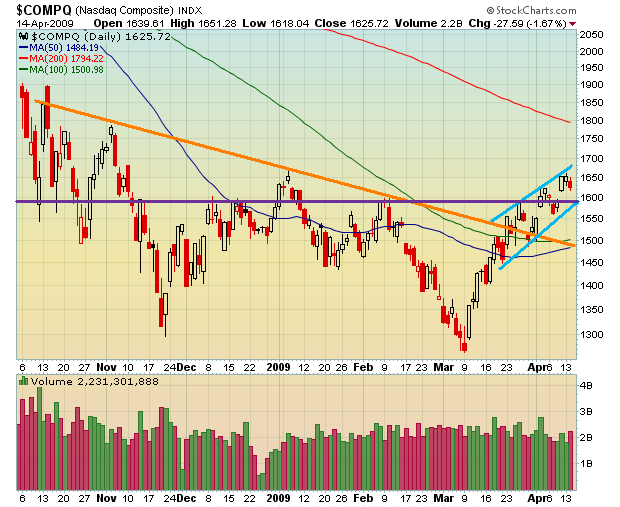
I added the chart of the COMP to show the striking distance to the 200-day MA for the Nasdaq. The index will first be met by resistance at the January high of approximately 1660 as well as the upper bollinger at 1677. I received several questions regardling the matter of scaling in shorts. I have not. I decided to add on the first breakdown of any group bullish pattern, such as the Method. So far, that has not occurred. Lastly, you can see the breakdown of the VIX to confirm and support the rally at hand.

Comments »

Just Chillin’

There are a lot of bears testing the waters here. I typically do not indiscriminately add shorts whenever I ‘feel’ like doing it, but I think it may be a good thing to start building a position, perhaps 2-3% sized positions at a time, every few days. Do not commit. This is the safest way to play the bear side. I’ve seen people add, and add, and add shorts all the way up until they could no longer take the pain. That will destroy you as your position size and losses multiply faster and faster. So, be careful.

My main position, FEED, is doing absolutely phenomenal. The initial position placed 2 weeks ago, is now up 42%, and the rest of the parts are up between 8-32%. Whenever you find these wave 1 symmetrical triangles, put it on the top of your priority list. They usually become parabolic momentum patterns and are accompanied by wave 2 and 3 advances with equal consolidations in between. They are one of the most powerful long side set ups you can ever find.

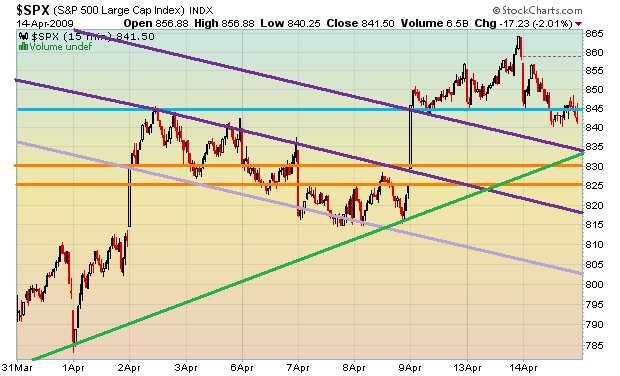
For the bulls, find support at the 100-day MA (828-830 SPX), which also coincides with the lower intermediate-term upper sloping range (825) and the multi-month long-term upper trend channel also hitting around 825-830. Immediate S1 support is located at approx. 834, prior to reaching 830, which is also the location of the April 9th opening gap’s marubozu. Make note that the April 2-8th bullish flag is being penetrated.

Comments »

SPX Flag – Day Two

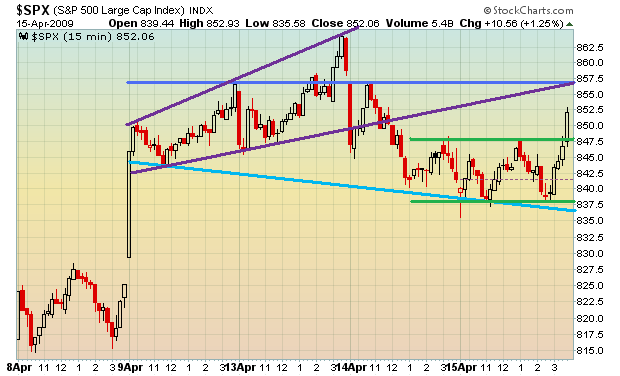
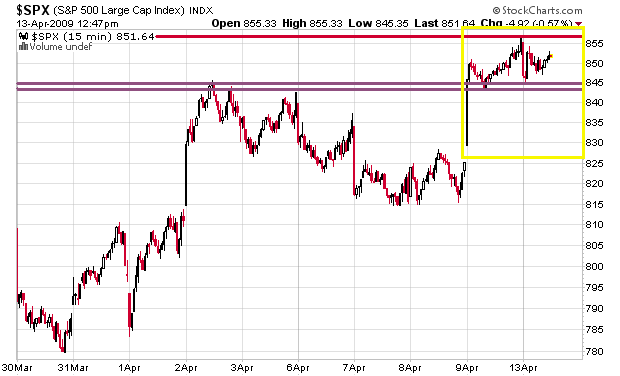
You can see the narrow range approximately between 845-855. This flagging action will favor the bulls.

Comments »