You can find the 3 firsts posts here : 1 , 2 & 3
The analogy has worked well last week,
It’s not possible right now to be sure that the 2nd interpretation that I favored was the good one, it will be possible just in hindsight the next few weeks. Nonetheless, this analogy works exceptionally well until now .
 It can be summarize like this :
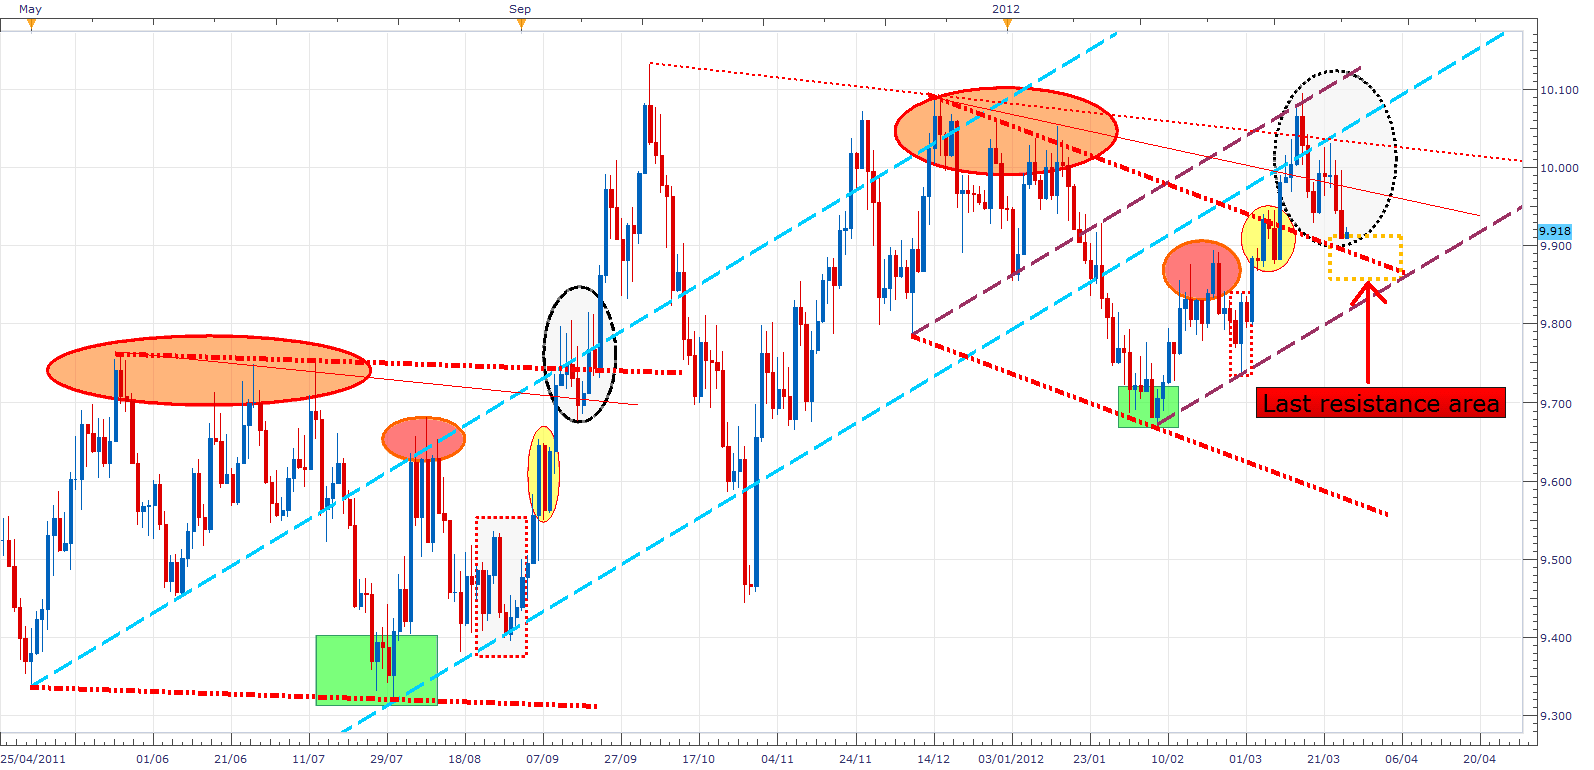
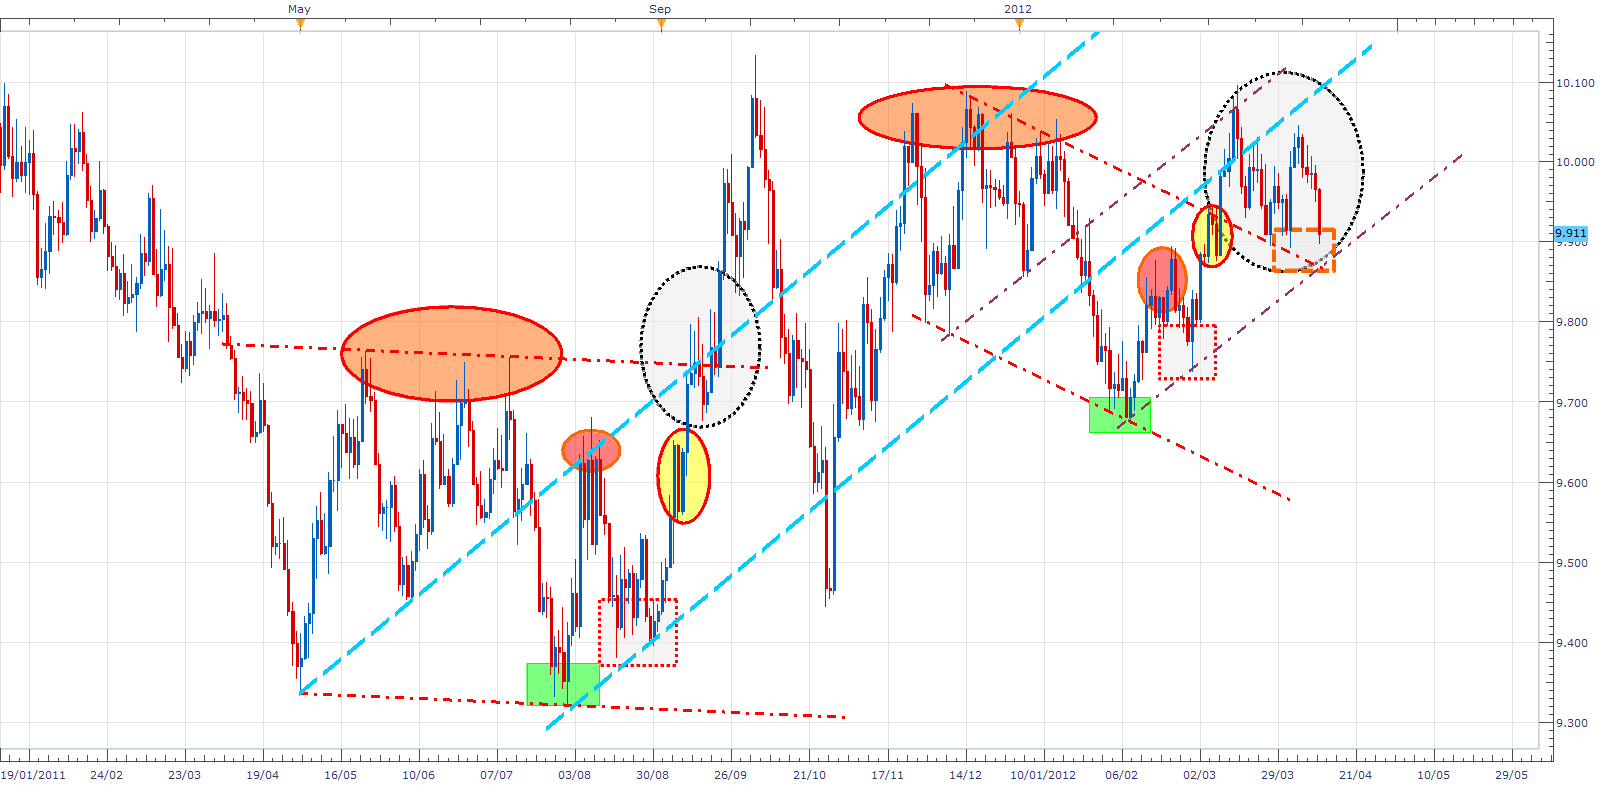
- Former highs with a few failed attempts to take over the highs : Orange area.
- Bottom : green area
- Reattempt to take the highs with multiple failures : Red area
- Higher low confirmed : Dotted red circled area
- Take of the last highs (red area) : Yellow area
- Take of the former last highs (orange area) , Dotted black circled area
So, what to expect for next week ?
I wrote last week : “This interpretation means that we could have a spike Sunday/Monday and a moderate choppy pullback for the rest of the week in the FXCM Dollar index, (it’s the black dotted circled area).” and “The 2 say next week would be a consolidation week for the $US.”
The move up really accelerated on Wednesday, but we finished the week basically where we started.
For next week, we should see Monday/Tuesday with an up FXCM $ , a correction on Wednesday and a rally at the end of the week. But as it is trading and not weather forecast, I would say that the $ should go up moderately the beginning of the week and try to test the resistance. Once this resistance would have been tested, the FXCM $ will rally strong .About levels, the $ has to close over the blue dotted line, if it will, it should retest this line of resistance that would become support and after, it should rally really powerfully.
I’m a big fan of the St Louis Fed indicators and have been watching a dollar index that they produce : The value of the USD on this index is determined by the exchange rate of foreign currencies of countries that trade with the US. Their relatives part in the basket is due of their share of the total American trade. We’re breaking ultra long term trend lines :

If you zoom in, you can see that the last rally since the middle of last year has had its support line retested several times :
 We already broke the triangle, pulled back, we’re in fact right now retesting the descending trend line after having tested the ascending one. We’re currently in a channel :
 More precisely at the bottom of this channel .
Because the analogy that I’ve been presenting since 2 months and those last charts, I’m hyper-bullish the USD…and Bernanke helped last week on the fundamental side…