Gambling title seems oddly appropriate, especially after watching David Einhorn taking down $4.3M in the ‘One Drop’ WSOP $1M buy-in tournament (which he’s donating to charity, by the way).
If you’re checking in on the 4th after an Nth round of debauchery with levels of inebriation approaching ‘that one time in college’ levels, you might want to come back and read it later. There’s a bunch of numbers and charts here that are liable to put you to sleep and miss out on the next round of ‘hey, y’all !!! watch this!’ fireworks display.
Wanted to write a quick update on the assessment of where we are in the market at this point, especially since signals I described in my ‘I bet it all’ post have just triggered (If you haven’t read the original post, it might be a good idea to do that in order to understand the 1st signal here).
First, ‘Planes, trains and automobiles’ signal update. The breadth thrust signal triggered today. Here’s an update on performance of the signals I mentioned in that post:

- As you can see, there are 2 new signals for 7/2 and 7/3/2012 with one on 7/3 being especially strong and fitting well within Whaley parameters. Typically breadth thrust like this indicates the beginning of a new sustained move higher. However, there is indeed a caveat to that. As you can see, the one outlier of poor performance in the whole set of data (at least thus far) is the 7/1/2011 signal. It certainly appears that when a breadth thrust occurs near 52wk highs it is much more likely to indicate a blow-off top than a beginning of a new bullish move. I would be much more comfortable with levering up long had we had this thrust when the market was down 10% than at this point – we are not even 3% off 52wk highs.
- Is there anything else that can support the bull case then? Something that would increase one’s confidence in this ferocious rally? Well, there’s the 13EMA of NAHL that I like to use as the long term indicator of where the market is heading. Something like this doesn’t really catch the very tops or bottoms, but is a decent indicator for a long term direction. 13EMA first waded into the positive territory on 6/20 and after a brief dip has quickly recovered and is now firmly above 0. That has certainly been a bullish signal in the past and bolsters the bull case on intermediate and long timeframes.

- We are also approaching the earnings season, and with expectations that have been severely beaten down are likely to see a series of reports that are way over analysts expectations.
- 50SMA on SPY has finally started to tick up today, possibly indicating the end of the correction as well.
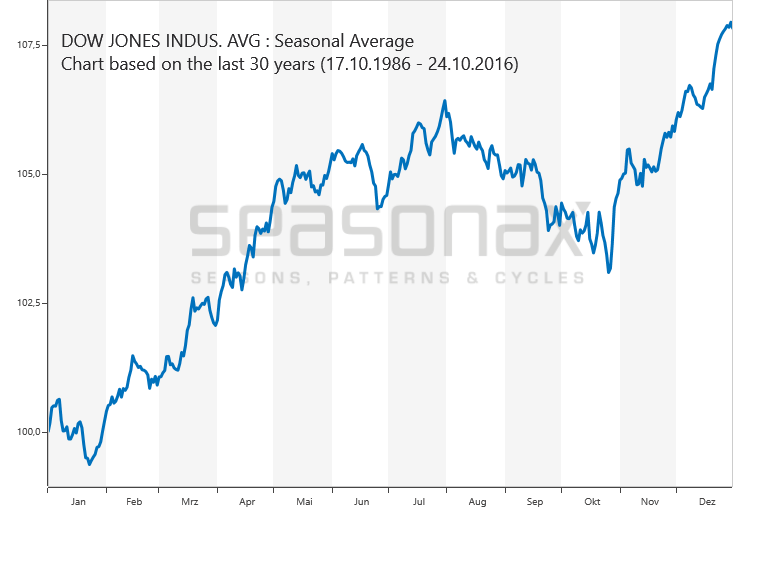
- And finally, election year seasonality is decisively bullish:

So based on these signals and assessment, should you lever up long and leave for a long vacation as it will be undoubtedly paid for (and more!) by the bountiful gains simply given to you by mother market?!
One thing to keep in mind is that we are severely overbought at this point, so much so that the value of NYMO reached 4th highest level in 14 years. Something like that absolutely has to be worked off through either price (moderate pullback) or time (few relatively flat sessions with indexes just drifting sideways). So hold off on getting that 2nd mortgage and selling wife’s jewelry to put it all in on a bunch of triple leveraged ETFs for just a few days.
When I look at the instances when NYMO reached very high levels (79+ in this study), short term picture (next few days) looks rather bearish (average 0.81% loss with 83% probability the next day and 1.75% with 70% probability over the next 2 days). Could it be skewed by horrendous losses of 2008/2009? Sure, but hard to guess just how much role that played in the overall picture.

Then there’s also the surprisingly well fitting analog of 2011 and 2012 charts of SPY (well, more precisely 9/2010-8/2011 with an overlay of 9/2011-now). I did cheat a bit by shifting this year’s numbers by about 2 weeks to ‘make it fit better’. While I don’t think there’s a great chance of repeating the last year’s summer debacle, especially in light of election year seasonality, considering that European shenanigans are far from over, keep this picture in mind.

So where does this leave us? While things can certainly change (even tomorrow since for some reason Europeans don’t celebrate the wonderful Independence Day of the United States and keep their markets open), as of the time of this writing things are looking up for the bulls on the intermediate and long timeframe. On the short timeframe we are WAY OVERBOUGHT and need to get these conditions relieved (through time or price). I did buy some TZA and SQQQ to hopefully take advantage of the pullback, but would not hesitate to cut them if it appears that we are just basing and not pulling back. Once the pullback is over (you’ll know it when you see it, but 1338-1340 levels seem like a good pullback target IF we pull back), I am certainly prepared to allocate a significant portion of my portfolio to the long side.
Enjoy the holidays, folks, and remember to let those bottle rockets out of your hand BEFORE they go off.