iBankCoin
Home / Tag Archives: QQQQ

Tag Archives: QQQQ

In the Presence of Tree Goats

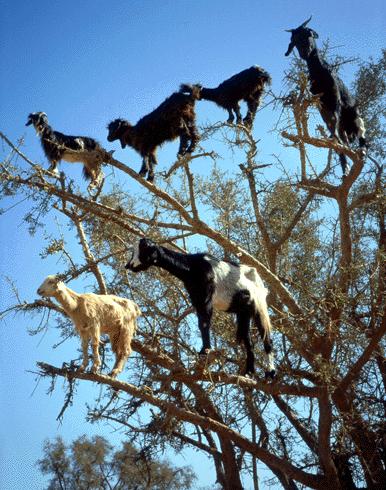
Not to be disparaging, but I’ve felt I’ve spent the week with a squadron of flying goats.   There you are flitting from tree to tree looking for the best green shoots, ears up and horns out,  “baaaaahhhing” it up to beat the band.   

Chips stocks!  Cancer stocks!  Lenny Dykstra Car Wash franchise stocks!  Get ’em while they’re hot from the chute!

But why must you make your lives so difficult?  There’s no reason to search for rare buds in the top branches of the acacia tree when there’s plenty of bull grass right here on the ground.   Come down from there and take a look at the freshly scythed alfalfa I have gathered for you, my yellow-eyed friends

Remember our weekly $HUI chart from last week?

hui_weekly1

Well, look what’s happened this week…. Pop!

hui_weeklyii

Can anything be more promising than that little green bud out of the consolidation zone?    And yes, we’re a little overbought here, and should be coming into some more resistance around 400 or so, but we should welcome that opportunity.  

After all my boy, it is a bull market — and maybe the only one you’ll see for years to come.  So relax some, take a load off, and get your nets ready.   It’s almost harvest time again.

This week’s Jackson Core Holdings Portfolio results were very pleasing, especially as measured against the indexes.   So have some nice goat cheese this weekend, and maybe try to pause a second whilst hoisting that relaxing beverage to remember those who have served, and especially those who have fallen in order that you could enjoy this great country.    Be well.

Name 5/8/2009 5/15/2009 5/22/2009
ANDE  $    21.50  $      21.31 -0.88%  $    23.34 9.53%
GDX        37.46          37.65 0.51%        42.05 11.69%
GLD        89.98          91.55 1.74%        94.45 3.17%
IAG          9.92            9.83 -0.91%        10.86 10.48%
MON        86.42          89.95 4.08%        86.61 -3.71%
NRP        23.39          21.29 -8.98%        22.21 4.32%
PAAS        19.35          18.66 -3.57%        21.42 14.79%
RGLD        39.90          39.97 0.18%        44.26 10.73%
SLV        13.79          13.77 -0.15%        14.50 5.30%
SLW          8.91            8.58 -3.70%          9.34 8.86%
SSRI        20.06          19.06 -4.99%        21.73 14.01%
TBT        52.24          49.13 -5.95%        53.57 9.04%
TC          7.98            7.65 -4.14%          8.64 12.94%
TSO        16.72          16.60 -0.72%        16.23 -2.23%
    AVG -1.96%   7.78%
   
Name 5/8/2009 5/15/2009 5/22/2009
SPY  $    92.98  $      88.71 -4.59%  $    89.02 0.35%
QQQQ        34.23          33.37 -2.51%        33.54 0.51%
DIA        85.47          82.78 -3.15%        82.87 0.11%
NDX   1,394.16     1,355.11 -2.80%   1,363.17 0.59%
RUT      511.82        475.84 -7.03%      477.62 0.37%
    AVG -4.02%   0.39%

_____________________________________________________________________

Comments »

What A Short Strange Trip It’s Been: SPX Again

Remember when I started posting for the start of competiton,  a little bit less than a month back?   I put up this look at the S&P 500 chart, to give an idea of where our regression to the mean (200-day EMA) targets might lie …

spx-daily

Well, here’s where we’ve come since that first chart, and perhaps some signs of where we might be going….

spx-daily1

As you can see from the above chart, the obvious resistance point is right ahead of us, at the segmented red line, which is also the not-so-coincidental meeting of the 200 day EMA (@ 950) and the early January cycle highs of about 945.   I think it’s highly likely we pause and at least digest for couple of days at this level, if not complete a pull back all the way to the 50-day EMA in the 840’s region.   

That said, given the power of this recent move, and the very convincing money flow into the large caps here, I think we may have even one higher push to go after this pause at 945-950.   I think this market will continue to confound the bears by continuing to overachieve in the face of  “not horrible” news.  I think we go all the way to that second (blue) line at around 1010, and with very little provocation.  

In addition, there’s one other observation that’s been intriguing me here.   Do you see how there is very little resistance (via the price-volume bars to the left) before almost 1200 on this chart, once we’ve broken through that second target line?  

How ironic would it be to see the few remaining bears’ backs broken as the market galloped heedlessly through that light resistance “free air” all the way to that more formidable resistance bar in the 1250-1300 region, only to finally turn poisonous once again, and decimate every true believer who had hopped on the treachourous bull bus of certain death by that late date?  

I hear you all telling me to put the Vick’s Vapo-rub away as you read this conjecture, but take heed.   It could get severely, almost Andrea Dworkinlevel ugly, and yet, I don’t see that “catch the market idiots” move as a fantastic scenario, given the current inflationary bubbles beginning to percolate in the PM , Earl, Ags and materials sectors.

But let’s face it, we don’t know what even tomorrow will bring for the SPX.   What we can use as a proxy crystal ball, however, is the Large Cap Techs as illustratrated by the following Cube Chart:

qqqqdaily

Note that the Cubes have already broken out of their consolidation zone, and are currently testing those levels on a pullback.   Note also they have breached their 200 day EMA, and are again, re-testing those levels on the pull back.   Note also how the Cubes’ oscillators have also turned down in response to this pullback?   

I expect the S&P 500 to follow its more ADD-HDAD tech-nerd brother in the same fashion over this next week.    And I believe the Cubes behaviour (sic) will continue to act as a “tell” for our overall market as well, so let’s keep a gimlet eye on both charts for the return of the bear, which I have no doubt is only on torturous hiatus here, and will be back soon to set fire to both young and old alike.     

Until then, peace be unto you and yours.

______________

UPDATE:  Covered 60% of my TSO June 17.50 short calls @ 0.70 ($0.52 profit), Bot 10k PLLL @ 2.15 – 2.20, bot 10k SVA @ 2.73- 2.75 (hat tip to Caveman Forecaster – post found here ).

Caveat:  If you choose to put on any of these trades there’s ample chance your wife will force you to live in a cave until early winter, and you could lose money, quickly.

UPDATE:  Bot 2k ELN @ 7.33 (hat tip to CA and RC’s  Circus of the Stars)

Caveat:  If you buy ELN at this juncture, and Irish drug addict could decamp on your front stoop, warbling “Black Velvet Band” til all hours of the morning and putting off your cats, AND you may lose money.

_____________

UPDATE:  Bot another 2k  of SLW @ 8.62 .  Acorns for a rainy day, see caveats above.


_______

Comments »