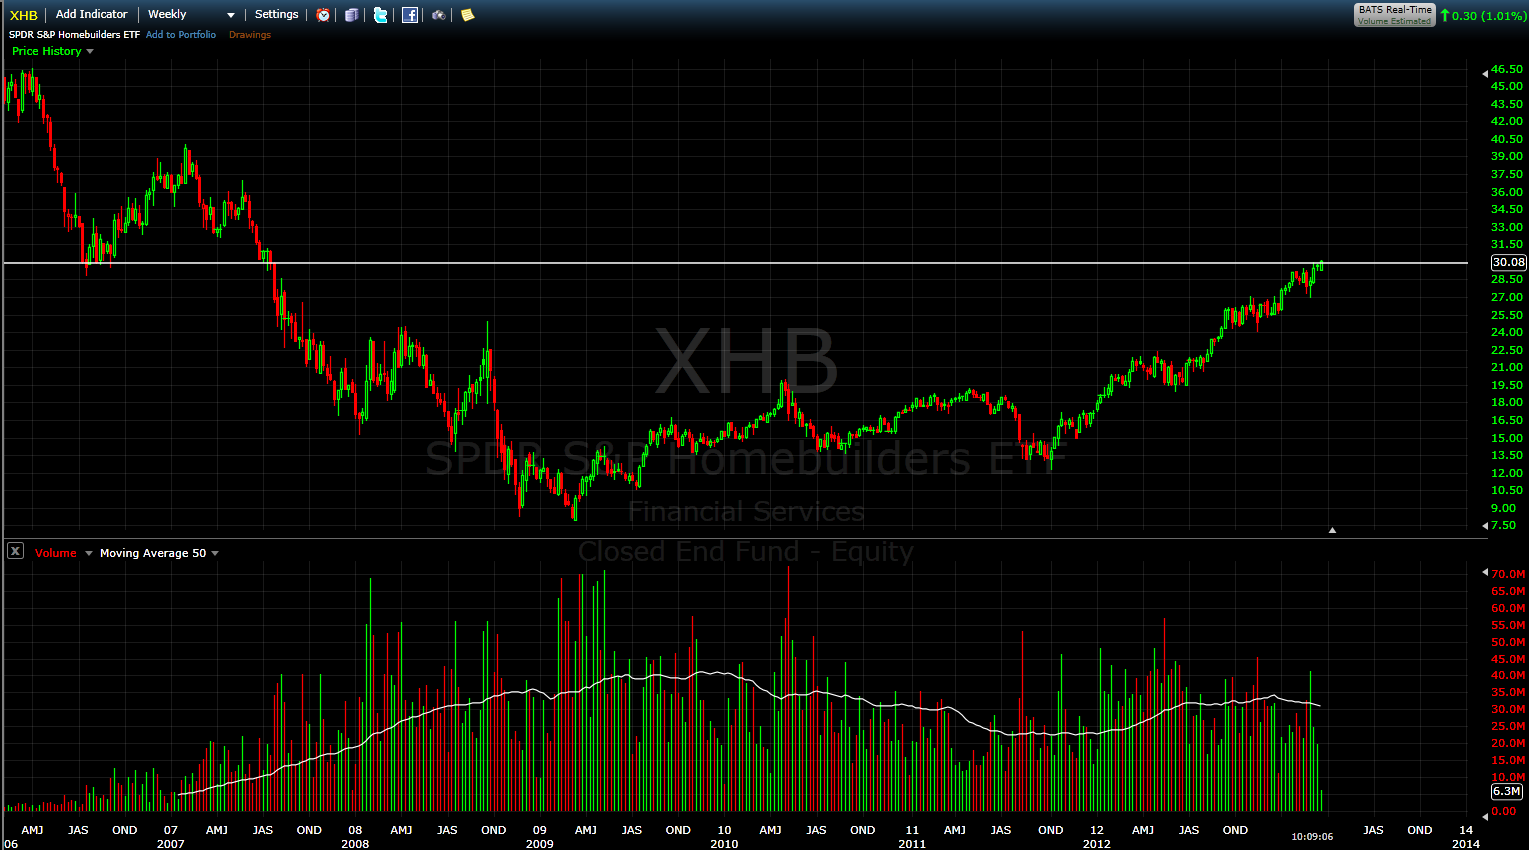
The XHB has been one of the strongest SPDR ETFs since the bottom in ’09, up a cool triple figures percentages. More specifically in this year, that trend has been in tact, up 12.75% YTD.
However, now may be an ominous time to initiate or add to positions in the XHB, as the simple chart below shows it’s hitting the underside of firm resistance from the fall of ’06. Volume has also dropped off significantly the past month on its approach to this level.

Comments are closed.

