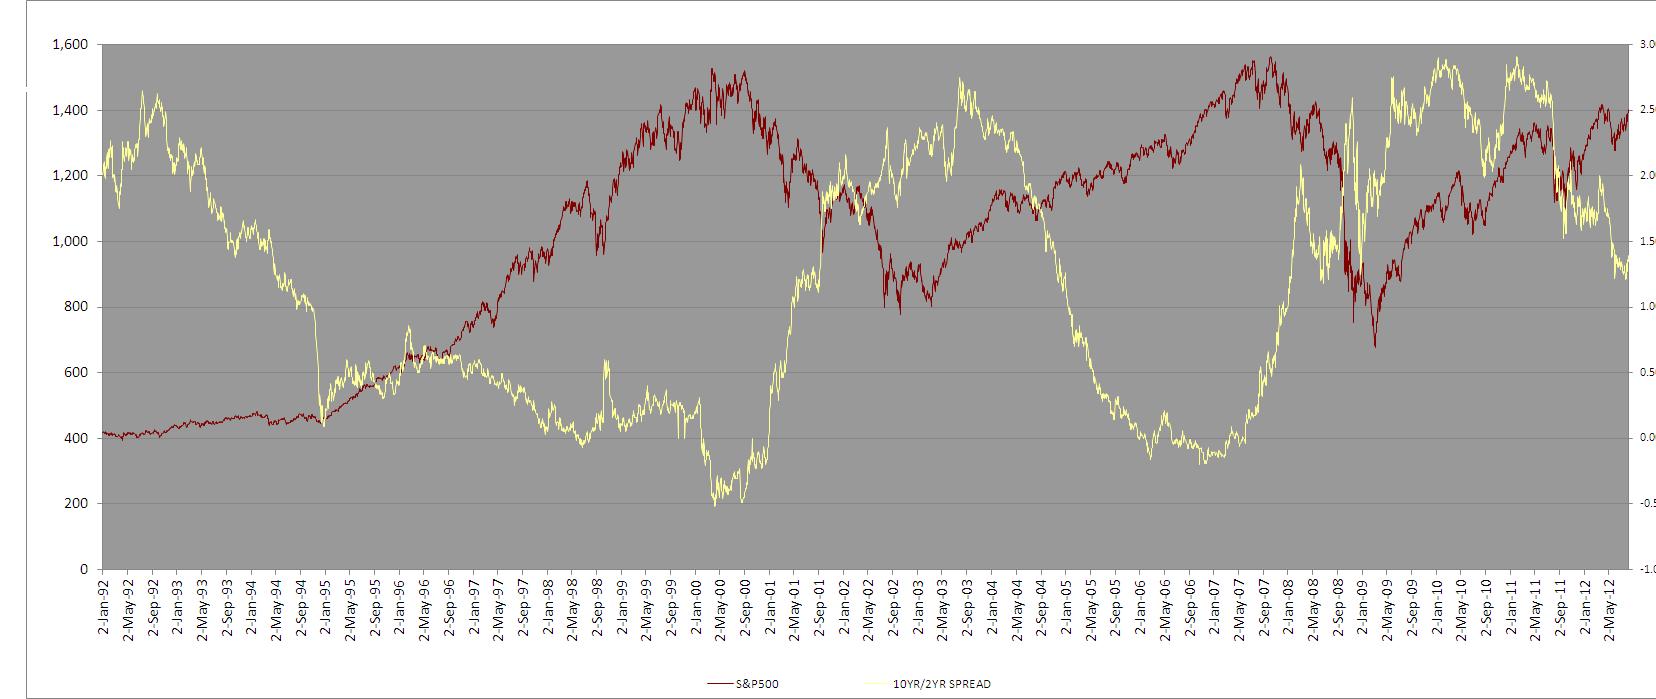
Inserted above is a chart which shows the last few interest rate cycles (10-Yr/2-Yr Treasury Spread) relative to the S&P500. Note how the interest rate cycle bottoms coincide with tops in equities. ZIRP is distorting the short end of the Treasury curve so absent a 2008-type panic it’s darn near impossible to get the yield curve any flatter (ie, the spread any tighter/lower). While Fly and others watch for rising interest rates on the long end of the curve (ie, lower TLT) as a sign that equities are headed higher, the widening of the spread via higher rates on the long-end hasn’t in the past traditionally portended higher equities.


4 Responses to “The Interest Rate Cycle & Equities”
schadenfreude
Noted today that TLT sold off to 125 fresh low and SPY did not put in a higher high.
Money can flee bonds into commodities like gold, silver, energy and USD, it doesn’t ‘have’ to run into stocks.
Berserker
Didn’t register in gold. Maybe the “twist” is out of fashion until after J Hole.
Bobby Boucher
Or maybe people are finally rediscovering that higher interest rates lead to compression of p/e multiples. Always have and no reason to think this time is different.
flyaway18
I think gold is about ready to make a really nice move.