Apologies for the double entendres. I still have bclund’s recent post on the brain. More seriously, on Monday, June 4th, SPY made a new 102 day low. As you are all well-aware, after making the new low, the market bounced, gaining slightly more than 3% as of today’s close. Tonight’s installment creates a rough model of this pattern, finds previous occurrences of it, and calculates historical performance after it occurs.
The Rules:
Buy SPY at the Close if
- it makes a new 100 day low AND
- the three-day rate-of-change is greater than 2.99%
SPY will be sold X days later.
No commissions or slippage included. All SPY history used.
The Results:

And below are the trades that were held the full 50 days:
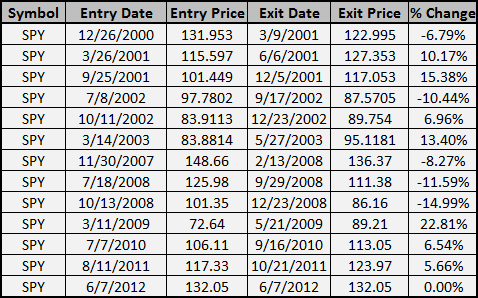
While there were 21 occurrences of this setup, there were only 13 samples held for the full 50 days. Those trades are shown above.
Even though the modeling was a rough approximation and not extremely specific, it still did not yield very many samples. The typical caveats about small sample sizes apply.
I posted the individual trades because I thought it was important to understand the impact of the 2008 trades. If 2008 can be considered an outlier, than the rest of the results are promising.
I’ve heard many traders guessing that the next few days will bring some consolidation and then another pop. Modeling of recent action shows that historically, that has been true.


Interesting study, Wood. Heavy volatility that seems to reward patience. Not too many samples, but with the exception of the ones in 2010 and 2011 it looks like they all occurred at the start of or during bear markets.
Agreud. The most important factor is the new 100 day low. Any market making a new 100 day low is not terribly healthy. The 3 day ROC mitigates this though and demonstrates the market’s desire to move off the bottom. While it doesn’t necessarily mean the bottom is in, I’m guessing it means that we are more likely to consolidate rather than cascade lower. Just a guess.
This guy posts an algo trade based on AAPL.
http://seekingalpha.com/article/640931-an-apple-story-alpha-algos-and-a-poorman?source=yahoo
Fairly simple buy Friday close, sell Tues close. Has a decent explanation as to why it works.
Curious what your analysis would say
Very cool. I’ll take a look at it this weekend. If I find anything interesting, I’ll do a post or leave a comment here. Thanks!