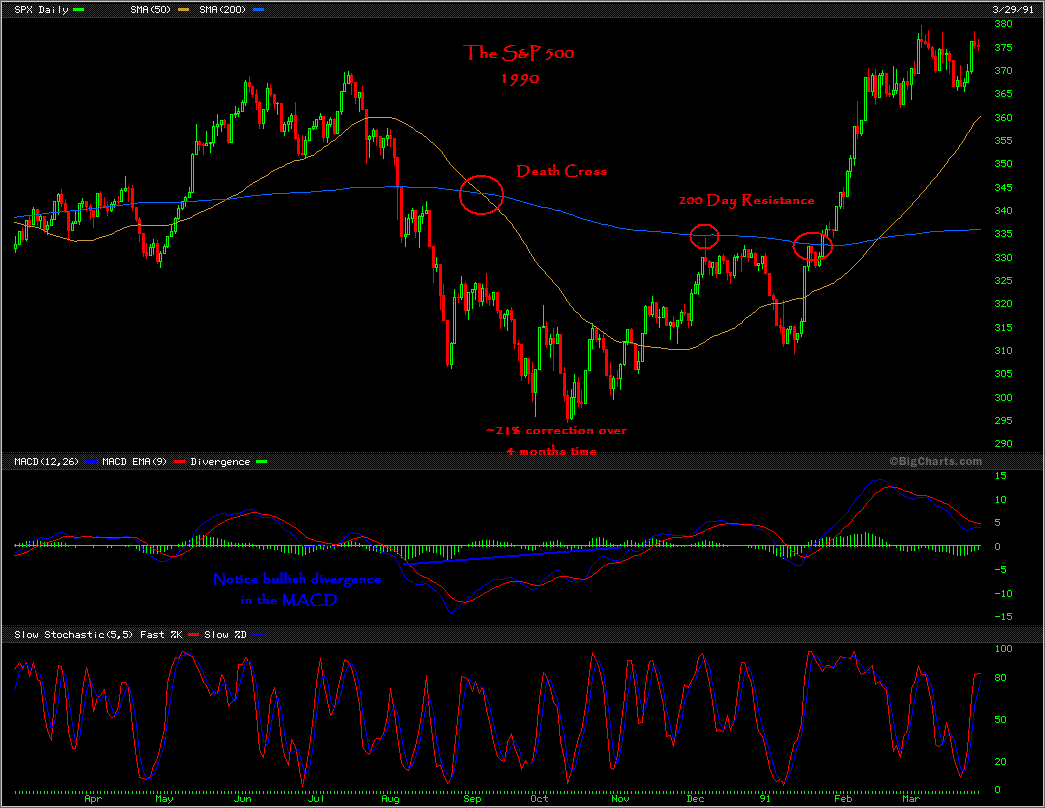
With all the talk of financials having bottomed (what about the other 80% of the S&P?), I think it is prudent to continue examining how market tops look. There has also been many mentions that this correction is like 1990, so lets examine the S&P 500’s 1990 top.
Unfortunately volume data is not provided, which makes it impossible to spot capitulation. However, the MACD did a great job of diverging from price and gave astute technicians an entry right at the bottom. Notice the Stochastics also do a great job of identifying each turn.
In this chart, observe the 50 day average. As the price re-takes this average, the bottom is in.
Comparing this top and bottom to the current SPX chart, it seems to me the average still has a good deal of unwinding to complete before bottoming. I would also like to start seeing some bullish divergences emerge. And most importantly, price needs to retake the 50 day average. However, the SPX is entering the 4th month of its correction phase. In 1990, the bottom was found in the 4th month.
Read other posts in the Examining Market Tops series here: Examining Market Tops.


Hey Shed, mind glancing at a chart of CEE and giving your technical take? Is that doji right on top of the 50-day a bullish signal?
Flux, that is a very interesting chart. I am going to add it to my personal watch list.
Today’s candle is hard to call. Is it closer to a doji, or a hanging man? Or a bullish hammer?
Those trading CEE are using technicals (look how yesterday closed). That means should CEE not overtake the 50 day, you know where it will end up.
Okay, my analysis is thus: It is recently off of new highs = bullish. RSI(2) is oversold = bullish. Didn’t make new low = bullish. Closed a nickel beneath 50 day = bearish.
My hunch is that it is rolling over; therefore, I would be leaning to the short side were I to take a position.
Here is the chart for those reading this-
http://stockcharts.com/h-sc/ui?s=CEE&p=D&yr=0&mn=10&dy=0&id=p36077199874
Wood,
I’d be completely the opposite…..long & strong based on the chart alone. [The CEE chart]
jog
Why Duc?
I agree the chart is more bullish than bearish. However, I’m probably overweighting the influence of the broader markets.
If the indexes weren’t bearish, I’d go long and strong on CEE.
Wood,
Simply as you say the chart is bullish.
If you are going to trade the index, why look at an individual chart in the first place.
jog
While that makes sense intuitively, it doesn’t make sense if one wants to capture larger percentage gains than the indexes can offer, without using leverage.
Based on today’s candlestick (hammer), RSI(2) & stochastics (both oversold), and intra-day action (heavy morning selling, bulls won at the end), I’d go long CEE.
But probably go slow until it does overtake the 50-day MA. Sell out as soon as it does not, or if tomorrow’s action drops below today’s low…
Just my 2c.
CEE gaps down and keeps going.
I’m hot right now.
Good call, Shed – looks like the broader market action wins.
Wood,
There you go, technical analysis a 50/50 proposition.
jog