From time to time I’m going to bring up holdings that I consider “core” to the Jacksonian Survival Strategy (TM). These positions, I hope, will be your ports in the storm for the coming (continuing?) rough seas.
TBT is the Ultra-Short 20+ Year Treasury ETF , described by its sponsor, Proshares, as:
… seek(ing) daily investment results, before fees and expenses and interest income earned on cash and financial instruments, that correspond to twice (200%) the inverse (opposite) of the daily performance of the Barclays Capital 20+ Year U.S. Treasury Index.
One of the basic theses of my Jacksonian analysis is that the Federal Reserve and its supervisory Congresses will eventually destroy the functional markets they’re charged to protect by repeatedly choosing the politically easy route over that of longer term system-wide financial integrity. Consider that the last truly “hard choice” taken by the Fed was back in the early eighties when Chairman Paul Volcker brought the Fed Funds rate to 20% in the summer of 1981 — which in itself was a hail Mary pass to stave off economy-crushing inflation rates.
The subsequent combination of a “cured” inflation problem, expansionary fiscal policy (read: increasing debt), lowered marginal tax rates, subdued energy prices and — most important– the financial peaking of the largest demographic bubble in this country’s history ignited a 17- year “boom” that culminated in the 2000 market crash and subsequent recession.
In the meantime, the Fed’s answer to any economic trouble remains “continue easing via lower rates.” Unfortunately, the conditions that allowed that solution to work from 1983-2007 (yes, they even worked after the dot-com meltdown), have begun to fall away, as the prosperity cycle gives way to the demographic shift of retiring baby boomers with fewer workers filling in behind them to support increasing government expenditures, not to mention debt service.
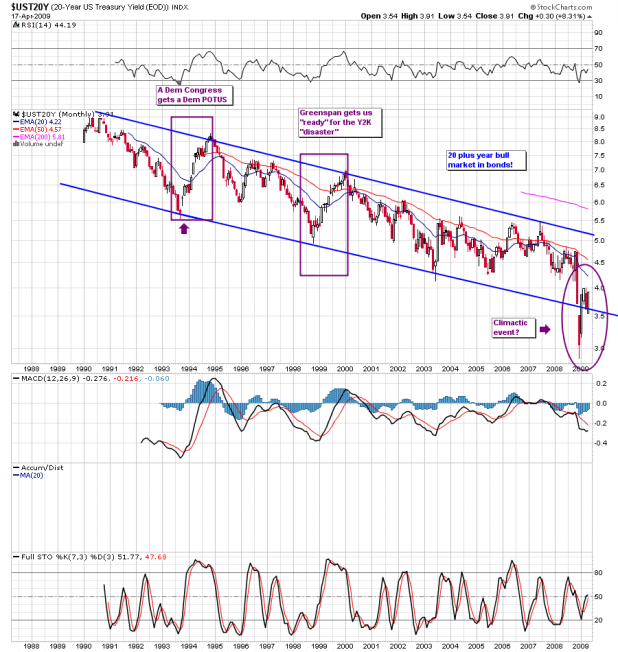
Combine that demographic turnover with the results of 22 years of moral hazard (Greenspan’s first “money flood” was a response to the 1987 crash), and we have a recipe for a turn in this aging two and half decade bull in US Treasury paper. Note the following chart (which — my apologies– I could only get Stockcharts to show from 1990) of the 20-year US Treasury Yield:

As you can see, we just had a break of the long term downtrending channel in November of ’08, which coincided with the gigantic selloff in the stock market as money fled to a safe haven. Could this huge breakdown and rebound mark the bottom of our bond bull? You can see that we’re back in the channel again, and have already tested the lower boundary on the monthly chart. As well, we’ve got a Democrat Congress and POTUS, just as we did back in 1993 (see first box), and the Chinese are making noise about buying less U.S. paper and letting the yuan rise (finally) against the dollar. Last, we need to issue more debt in order to pay for this unprecedented “stimulus” spending recently signed into law.
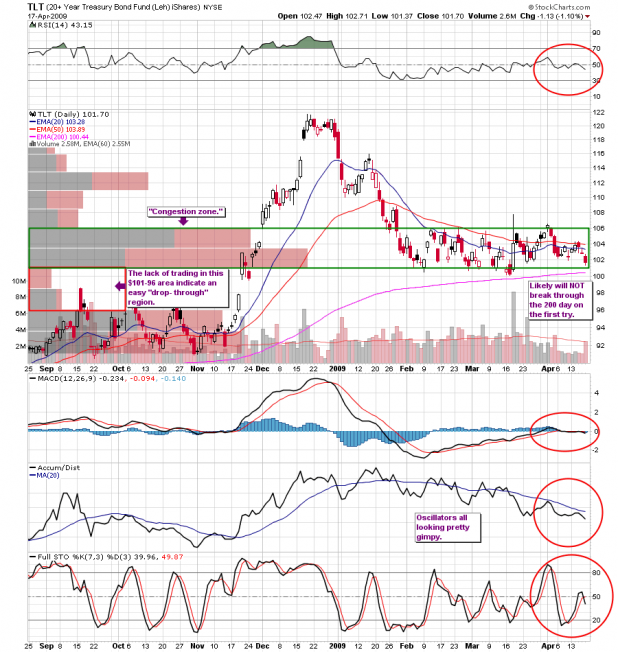
If anything, this bodes well for bond bears in the short term, despite our current “safety haven” status. Let’s see what TLT (Lehman Bros. 20+Year Treasury i-Shares ETF) is telling us:

Note how TLT soared as a result of the first fear induced drop in the stock market? Now notice how it made no such similar move when the market ground down to a lower low? In fact, after a month of increases after the November 21st market lows, TLT peaked on the day after Christmas, and has largely ground lower ever since. This despite a new low on the stock markets. Whether or not the US long bond has been given up as a safe haven we won’t know until we see a decisive break of that fast-approaching 200-day EMA, but I think TLT is telling us something here.
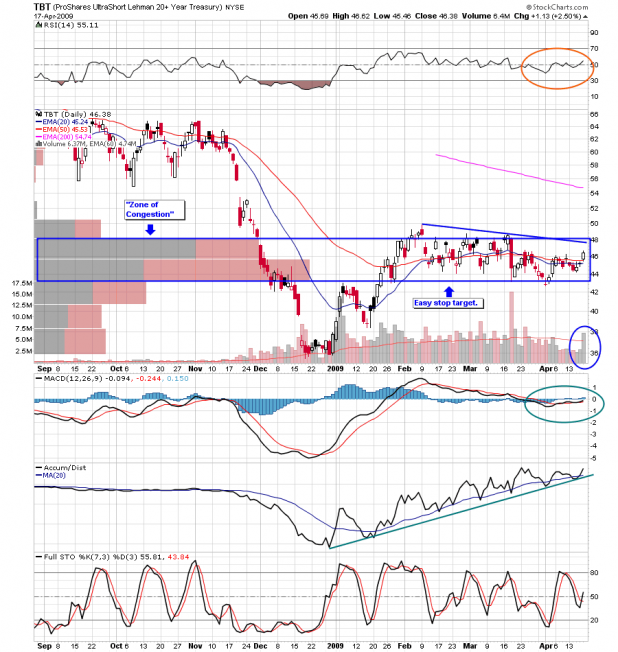
That brings us up to TLT’s double inverse, TBT:

Note the steady accumulation since late December of ’08, even as the MACD took it’s sweet time to eventually turn north again? Now all of our oscillators are telling us similar story. I see TBT as a core holding for the long term here– and I’ve been accumulating it from $50 all the way down to the $37’s — but for our more short term oriented folks, I believe that a break of the above noted “congestion area” will bring us very quickly to the 200-day EMA. This lift-off may even be in conjunction with the rest of the market, as low yields are abandoned for stock market lucre (however fleetingly). We should be watching the TLT 200-day EMA here and our congestion zones. In the meantime, I see TBT as an “accumulation pick” going forward, keeping in mind the usual precautions we should always employ while holding volatile double ETF’s.
More “ports in the storm” to come. Best to you all.
Comments »