iBankCoin
Home / Uncategorized (page 300)

Uncategorized

A Fresh Start to a New Year

russia_wtf_2

The change in character in Japanese stocks is apparent, observing the updated EWJ country ETF, first daily chart below. As I noted earlier, this is happening while the Yen rallies. Last year, it seemed as though Japan often led the U.S. rally. So, it will be interesting to see if the weakening Nikkei drags us down, as well.

Also, check out the weekly chart of Amazon, second below. This is the first 20-period weekly moving average test in several quarters. A breach of it would mark a change in character for the worse, considering the stock always seems to snap back immediately from any earnings selling.

Other than that, I am still sitting in full cash waiting for the market to tip its hand, avoiding today’s whippy action.

____________________________________________________

EWJ

____________________________________________________

AMZN

Comments »

Five Sweet Stocks to Accompany Your Friday Lunch

texas_3

Courtesy of The PPT algorithm, here are the most current top five readings from my “12631 RELATIVE STRENGTH” custom-made screen, identifying which stocks are exuding some of the best performances to the market at-large at any given moment.

I look for stocks whose Daily PPT Hybrid Score surges, while the Weekly Hybrid has been negative over the past week. This can often yield stocks which are emerging from consolidations.

Members can click here to view and save the screen.

Sorted for at least 500,000 shares of daily average volume to ensure liquidity.

Please click on image to enlarge.

________________________________________________________

2014-01-31_1227

Comments »

Making Sense of the Cold, Dark Winter

FvlWvf2

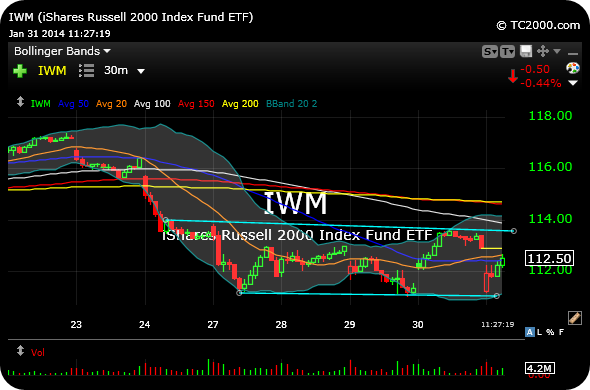
Chart patterns constantly morph, and we are seeing just that with our ongoing look at the 30-minute timeframe for the small cap ETF, first below. Note the broader channel is in play, dating back to late-last week. Bulls need to get back over $114, most likely.

And on the second chart, below, to update the Yen ETF, a move back over $96 likely sees another surge in the Yen and all of the potential risk-averse repercussions which could from that.

What are you trading this morning?

________________________________________________________

IWM

________________________________________________________

FXY

Comments »

Trapped in There

Be7PyxRIcAA4BYB.jpg-large

The current market continues to distinguish itself from the 2013 game plan, at least several aspects. First, dip-buyers seem to be punished for assuming upside follow-through will materialize, unlike in 2013, and are now better off selling their inventory intraday, i.e. near yesterday’s highs.

Beyond that, the general consensus seems to be to look for a multitude of reasons why the market is close to a bottom, illuminating how sentiment shifted from widely bearish at the beginning of 2013 to mostly quite bullish this year.

While it is still quite early to term the current market action as overly bearish or damning to the bull case going forward, with the S&P only a few percentage point off all-time highs, the churning of dip-buyers is a new wrinkle we are seeing this year in contrast to the many V-shaped rallies to fresh highs last week.

I walked into this morning’s gap down sitting in 100% cash inside 12631. While JO is running away from me higher, UNG is still in consolidation mode and punishing latecomer longs. Indeed, discipline can be a two-edged sword at times, but avoiding the big drawdown is still key.

The social media stocks are showing relative strength this morning, namely ANGI FB LNKD TWTR, but they may be just holdouts before they drop with the tape, too. 2013 would have none of that, but in 2014 so far there are traps to respect.

In sum, I am sitting in cash and letting the dust settle with a sloppy S&P 500 Index daily chart pattern still in play.

Comments »

Wait Three Days, Then You Can Go Down the Alley

XBcjjyA

While I still have my concerns about Apple’s monthly chart, as I mentioned before, the daily chart has now had three days after the earnings selloff to shake out the hot money and readjust to the disappointing earnings.

The stock undercut the psychological $500 level as well, no doubt taking out some stops placed there.

As a result, I think you can at least consider Apple for a quick flip on the long side, up to one or two days, intraday mostly.

The three-day rule has been met as the stock drifts below its lower daily Bollinger Band. Apple is now beaten-down and I would not want to be short it here.

What are your top watchlist ideas this morning?

_________________________________________

AAPL

Comments »

You Can’t Blame the Weather for This Airport Delay

The following is just a small excerpt from my latest Weekly Strategy Session (please click on that hyperlink for details about trying it out). which I published for members and 12631 subscribers this past Sunday. 

Boeing is still one of the more of the interesting potential plays in the market to me, as a looming short trade. Keep in mind, however, that I advanced the long-term bullish investment thesis on the name back in December 2012 in this post.

Since then, though, the stock has essentially gone parabolic on the monthly timeframe, updated below. These apparently competing theses do not contradict each other, though, as a long-term investor in Boeing and the aerospace & defense stocks could easily short them for a near-term trade given the current technical setups. 

Earnings for Boeing are next week, and you know I rarely trade through earnings. So, I am presenting the chart to you more as the poster-child for many other similar-looking charts in the aerospace & defense sector, such as GD LMT NOC RTN. In my view, they are all still wildly-extended, an argument I have been making for many months now.

Still, you can see that Boeing has gone nowhere since last November, with $140 being notable resistance after a steep uptrend. Beyond that, as I note on the chart, barring a strong recovery after earnings next week the stock is likely to out of January with a textbook “shooting star” monthly reversal candle (which would, of course, require downside confirmation in order to prove as a true reversal). 

Much like the rest of the market, let us see if the rubber band finally snaps in a more straightforward manner this time, punishing the 2013 bluff-catchers.

BA

Lockheed Martin would be an example of a more actionable short setup this week, with earnings out of the way.

Note the weekly chart bearish engulfing candlestick printed last week, putting us on watch for further downside confirmation of a potential major reversal in trend. 


Please click here to continue reading

Comments »