
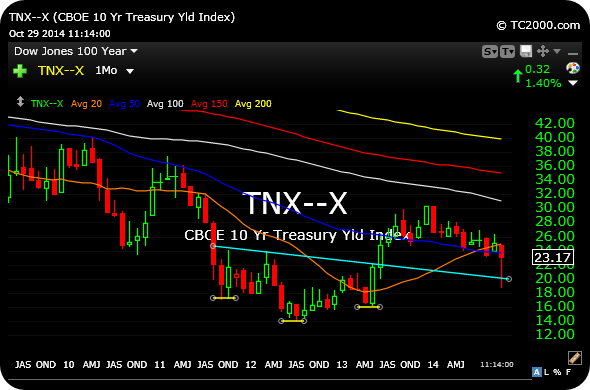
That spike higher in bonds, and thus spike lower in rates on the 10-year, temporary took yields below their primary breakout level from the confirmed inverse head and shoulders bottom from 2011-2013.
Below, on the monthly chart for the TNX, or 10-Year Treasury Yield Index, you can see as much.
But yields did not stay down there for very long, and the bottoming formation is still intact.
Headed into the Fed today, I am still looking to see if the bond market decides to rebel against the Fed and express a loss of confidence in their policies. In my view, the bond market is likely the only entity who can, in theory, prevent the Fed from doing whatever they please.
_______________________________________________________


hmm I zoomed in on that picture like I should be zooming in on stock charts.