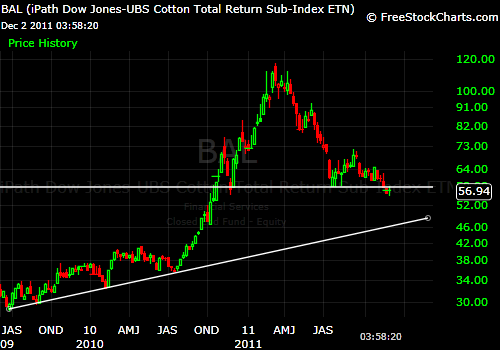
Many commodity-related ETFs have not been participating in the recent rally in equities. You can look up charts of JO (coffee), GRU (grains) and SGG (sugar) yourselves. Below I present the weekly chart of BAL, which I found to be the most interesting. It is much clearer to see on the daily chart, but BAL broke down through support at the horizontal line and has rebounded meekly to what is now resistance. . This breakdown would normally suggest that BAL will visit that sloping line you see in the chart. However, I wonder if that was a false move down. According to the seasonality study in The PPT, BAL has gone up in December three out of four times for an average gain of 7.4%.
http://www.youtube.com/watch?v=fCCs8r5NguE

Comments are closed.
