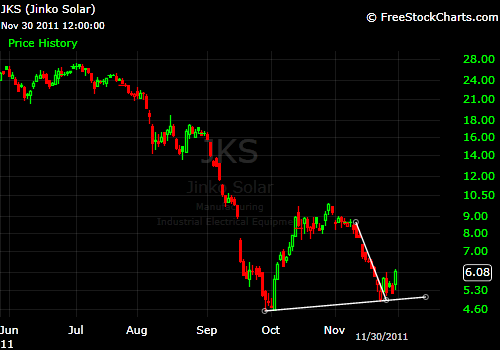
I can’t follow the 3,000-plus stocks I follow during the day, so some decent ideas have to wait until I review my charts at night. The daily chart below of JKS caught my attention tonight. It has the Herman Cain pattern, an unfilled gap at 7.71 (it closed today at 6.08) and a double bottomish thing going on. I would go small and put a stop at either today’s low (5.28) or at the trend line. If it gets over 9.90 or so on good volume, 13.40 could happen. I have no position in this, so don’t bug me for opinions if you buy.
http://www.youtube.com/watch?v=LQj–Kjn0z8

Comments are closed.
