I know, I know, you’re all weeping to see me go. Especially our hot headed “Commie Cadre” of dedicated (if deluded) Obamaniacs.
Don’t worry, we will have ample opportunities to contine discussing the Obamessiah in future “Reg’lar Ole” Peanut Gallery Posts (I know, you’re thrilled). But for my final posting, I promised the Fly I’d look more closely at this damn Yen Carry trade about which Calvino and myself are always squawking.
To describe it simply, the Yen-Carry Tradeis a well abused arbitrage where money arbs take a relatively low interest rate currency (in this case the Japanese Yen) and sell it short (ie, “borrow and sell”) in order to purchase higher yielding assets in a separate currency (in our case, dollar assets).
Mostly, these guys keep it simple and just buy higher yielding U.S. Treasuries with their borrowed yen, but a good amount of this dough ends up in the equity markets as well. So it’s not uncommon that you will see a an inverse correlation in the yen price and the [[$SPX]].

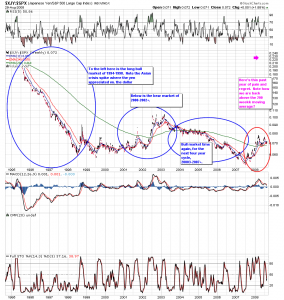
The chart I’ve included above (click it twice to see it up close) is a weekly Japanese Yen to S&P 500 ratio, starting in August of 1994, just as the massive bull took off in U.S. equities.
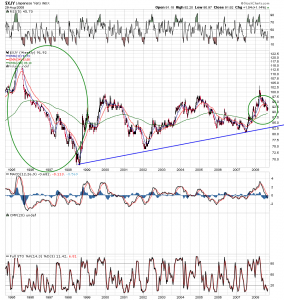
Note the stunning plunge in the ratio as the yen depreciates against an ever increasing $SPX, mitigated only by the “blip” caused by the 1998 Asian Currency Crisis, which actually strengthened the yen while weakening the ratio for a brief period (note, you can see this yen strength even better in the stand alone Yen chart I’ve posted below).

When the bear market took hold in late 2000, however, one consequence was the unwinding of this yen carry trade, and you can see that in the rebound of the Yen/S&P ratio to a more positive bent starting towards the end of 2000 (when our markets began to crack for good) as the yen grew stronger against the SPX, and culminating at the end of the last bear cycle in 2003.
But look at how the Yen signalled the carry was coming to an end more than full year before the US markets actually peaked in March of 2000! And note how the Yen has been “chuntering about” but generally moving higher ever since that bottom? It’s been harder and harder for the carry trade to work, because it really only provides a return if the lower yielding currency stays cheap. If that lower yielding currency starts getting expensive, the trade must be unwound. Very important.
Note also that since that final bottoming back in 1998, the yen has gradually been on a slow and steady uptrend, even as it’s been routinely sold down by the carry traders. It remains on an uptrend to this day, and this means bad news for US equities, I believe.
Here’s my take: In a period where pressure already being placed on our system by fundamental internal market forces, a reversal in the carry trade — or worse, a complete abandonment of it — can have disastrous effects on our equity and bond markets. I think our bond markets can withstand the shock (and as you might note, they seem to have done so), because they are much larger liquidity sinks than our equity markets.
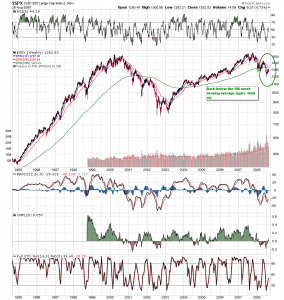
I’m not sure our equity markets can take it, however, and that’s why this last graph is the most foreboding of all. It’s the last component of the ratio in stand alone form — the S&P 500 itself on the same 14 year weekly time view.
Note how ugly the market got after we broke through the 200 week EMA back in early 2001? Well, we are looking at a very similar chart formation today. And with a yen that looks like it’s “tanned and rested” and getting ready to take off again, I think we might have the makings of our own very special equity market “Hurricane Gustav” coming this Fall, and nothing but the short ETF’s will be shelter in that storm. Carry on… or off, as it may be.

Good luck everybody (especially my weather-beating successor Veritas), and thanks for “abiding me” — even at my most cantankerous — over this long hot month. Look for updates in the PG, as warranted. Ciao for now, Jake.
Comments »


