You guys already are being feted by gunslingers aplenty on this site, and gosh knows, you’re far better off going to Fly, Cajun and Gio for the day to day, and even minute to minute stuff. Being a guy who’s got a business to run, I can’t always keep an eye on the market from minute to minute, and I suspect at least half of you are in the same boat. Personally, I’m always on the lookout for relatively safe stuff I can purchase with a “sleep at night” perspective.
Therefore, I’ve decided to limit my stock recommendations this month to those long term “try and holds” that you can put away for longer periods of time, whilst eschewing the more go-go stox (sic) our iBC trader-types hold for less time than it takes a banana to go yeller.
Most of you know I’m a bear “ovah heah” and came to that conclusion after finding way too many sectors with nothing but bleakness on the horizon, starting back in late October of 2007. I do think there’s a way to survive this market, however, by buying at the right time and holding until a cycle turns.
Despite my bearishness, I believe there are still sectors that make sense for the long term, given certain economic realities like the dreadful Fed-induced devaluation of the dollar and the ever increasing costs of healthcare. I think these realities will continue to keep commodities and bio/pharma/healthcare stocks attractive going forward, even as we may suffer through the occasional liquidity contraction like we are right now in the commodity sector.
The weekly charts are helpful for “perspective” in these type of meltdown situations, and I believe they can often give us hints about an attractive time to make a safe purchase, especially when they’re used in conjunction with long term fibonacci retracement levels.
By the way– I’m going to take the fundamentals of these particular companies as a “given” but I encourage you to research them on your own. Suffice it to say, I take the GE approach on my long term portfolio investments and try to only invest in the “#1” or “#2” best companies in a particular industry.
With that factor in mind, I think if you consult with Fly, Alpha, Chivas, or any of the other professional money managers that frequent this site, they will agree that Chesapeake Energy Corporation [[CHK]] is the gold standard in the natural gas exploration and distribution category.
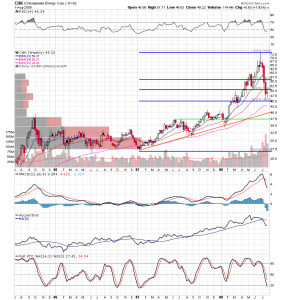
Above is CHK’s weekly chart (click on it to enlarge), and as you can see, Chesapeake has been hammered almost unmercifully during this recent commodity pullback, and it is well off it’s highs of $73.00. The good news is Signor Fibonacci gives us a pretty great — and safe! — entry indication in the $45.00 area here, right where the “super strong” 61.8% fib retracement line lies. You’ll note from my previous comments that the 61.8% and 38.2% (inverse) lines are my two favorite fib lines, and they serve me as well as great exit/entry points for both shorts and longs.
For these CHK fib retracements, I used the early January ’07 lows as my starting point (as you can see, that’s a pretty strong support line going back some time), and the recent late June ’08 highs as my top fib level. Fibs aside, there’s additional support $5.00 lower at $40.00, where not coincidentally, the long-term rising uptrend line is currently in residence (orange line). So my advice would be — don’t go “all in” at $45.00 — make sure that support holds first before committing total funds. This is only prudent management. The good news is, we’ve already visited $45.00 once, so if CHK can make a second visit to that level and rebound nicely, you’re even better off with your gift from Senor Fibonacci.
Buena Serata!
Comments »


