iBankCoin
Home / Tag Archives: Trading (page 15)

Tag Archives: Trading

The Insatiable $AAPL wants more!

I was doing my normal stock stalking and then all of a sudden, $AAPL blew me a breeze and winked her eyes at me.  One look at the chart and I could see what $AAPL meant.  She wanted to get high with me.

“Come over here and take me with you, NOW!”

Jeez, I couldn’t say no to that, immediately, I bought some $AAPL and she was right, she really wanted to go higher.

Look at the $AAPL 5m chart below and you will know what I mean:

AAPL_5m

Take a look at the 15m chart below:

$AAPL went over the resistance established yesterday @ 09:45am.

AAPL_15m

So far, $AAPL is making me very happy! 🙂

My 2 cents.

Comments »

SNAP! But the mouse ($DDD) got away from the trap…

It was a trap alright, as predicted by The Fly, and I was stopped out early in the morning; however, being stopped out is only a rest stop for me to take a break, so I watched for a floor to form in the 3m chart and it did.  Without hesitation, I jumped right back in with stop below today intra-day low.  After some struggling with the bear, the bull finally won over later in the day.

The daily chart does look incredible promising for a possible rally to the upside.  Look how the green bar has already penetrated the downtrend line.  $DDD is one of those animals that, when spook, will run three miles in a New York minute (up or down).  I’m expecting to see $DDD make a mad dash to the upside next week if the general market is done with the correction already.

DDD_daily

Below is the weekly chart:

DDD_weekly

Look at the solid green bar being formed this week.  They even have a name in the candlestick library to identify the pattern of today green bar versus yesterday bar.  It is called the bullish piercing pattern.

I added more $DDD so I now hold more than I’ve held yesterday.

My 2 cents.


Comments »

$GLOG jumping beans may be bouncing higher

I’m a big fan of jumping beans.  They are just curious fellows and it is always a delight to watch them jump all over the place.

So when I looked at the $GLOG chart, I couldn’t help but remember the jumping beans.  There was this one bean that jumped so high it went over the box…  and I think this $GLOG will do just that.

Take a look at the daily chart:

GLOG_daily

Did you see the resemblance of the jumping beans in the price actions for the last month?

After falling off from the uptrend line, $GLOG has been consolidating for about a month; I think it will soon resume it bounciness to jump much higher.

Take a look at the weekly chart below:

GLOG_weekly

There is a solid base and support around $12.17 area. The overall trend (blue line) is still up.

Once the general market brush off this consolidation and head higher, $GLOG will jump much faster is my take.

I bought starter position on $GLOG today.

My 2 cents.


Comments »

Consolidation with bias to the upside

The daily $SPY chart below shows that price action is bouncing off the Giant Wall 1 but still below the resilient Giant Wall 2.

SPY_Daily

The weekly chart below shows that a solid uptrend is still intact.  I like the fact that we have a green weekly bar in mid-week.  If this is a red bar with price below the GW1, I would be worry; however, current green bar provides positive bias to the upside.  My bet is that by end of week, $SPY will attempt to breach GW2 once again.

SPY_weekly

My 2 cents.

Comments »

The battle at Giant Wall 1

Breaking news from ZENews!  Sally Comegetme is on location reporting…

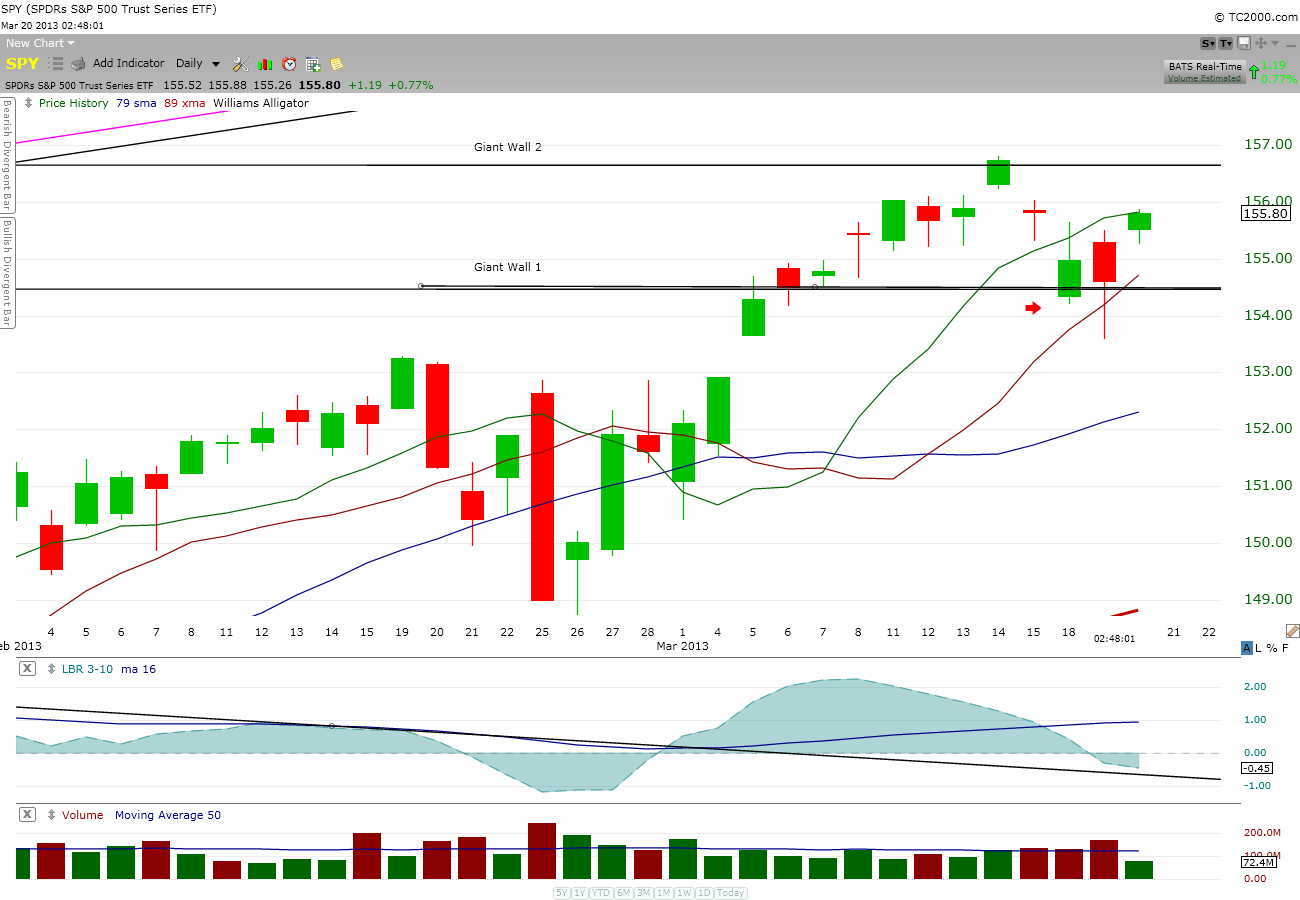
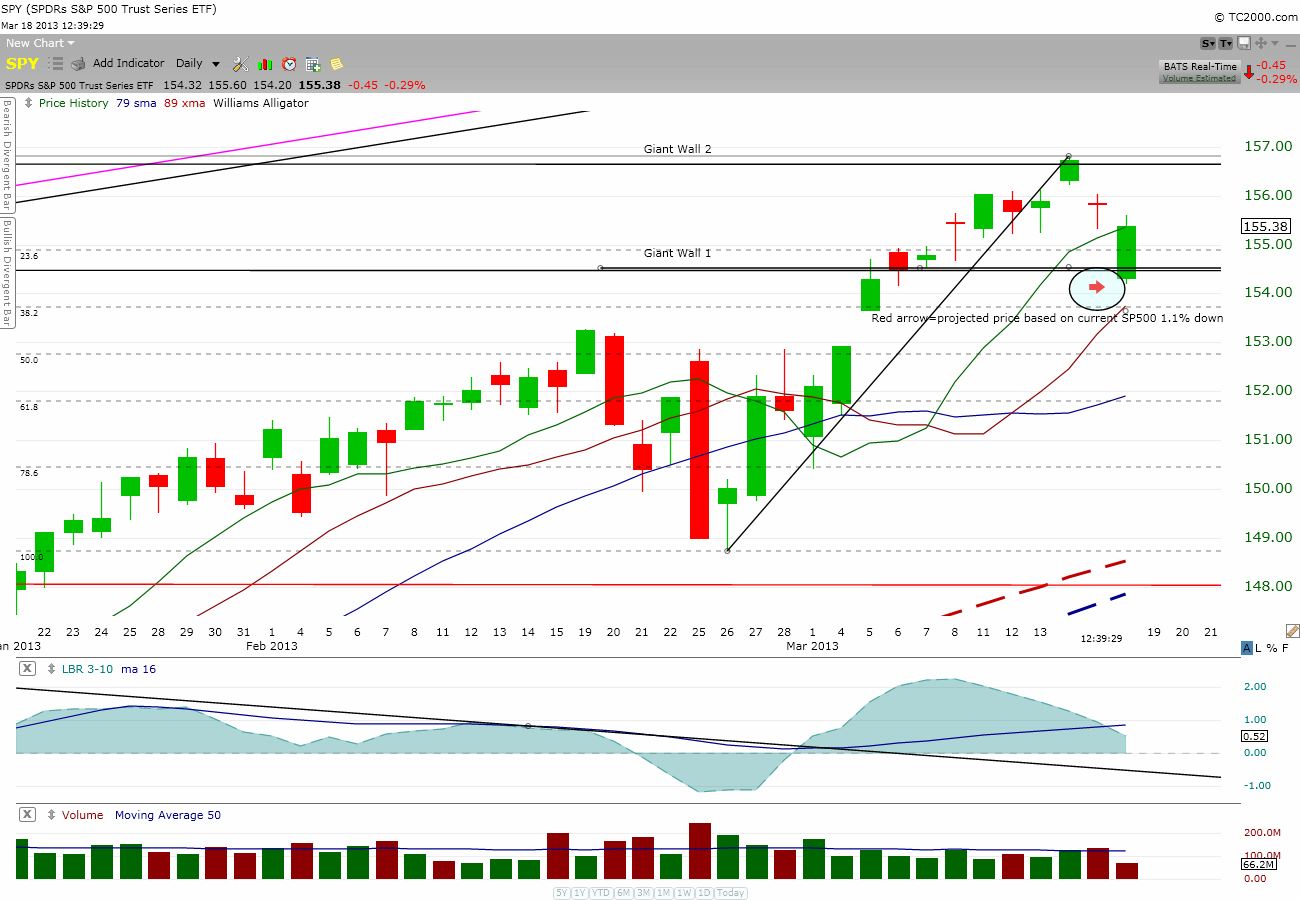
“Zen, we have a fierce battle going on here but I can see the Bull is putting a strong defense.  From where I stand, I can see the Bull is still fighting in the proximity of the Giant Wall 1 and the Bear could not move the bull away from the wall.”

Without warning, an arrow zipped right through b/w Sally and the cameraman and almost threw the cameraman off balance to the ground.  The camera was accidentally pointed to the sky for a brief seconds during the tumble and we could see a dragon flying its way down to the bear camp with fire shooting from its mouth.

“Whoa! Is that a dragon I just saw?”

“Yes, but they are friendly to to the Bull, Zen.  Wow!  Did you see that Zen, the Bear camp just light up like a Christmas tree!   Way to go, dragon-bull!”

Without warning, the connection was cut and we lost the picture of Sally.

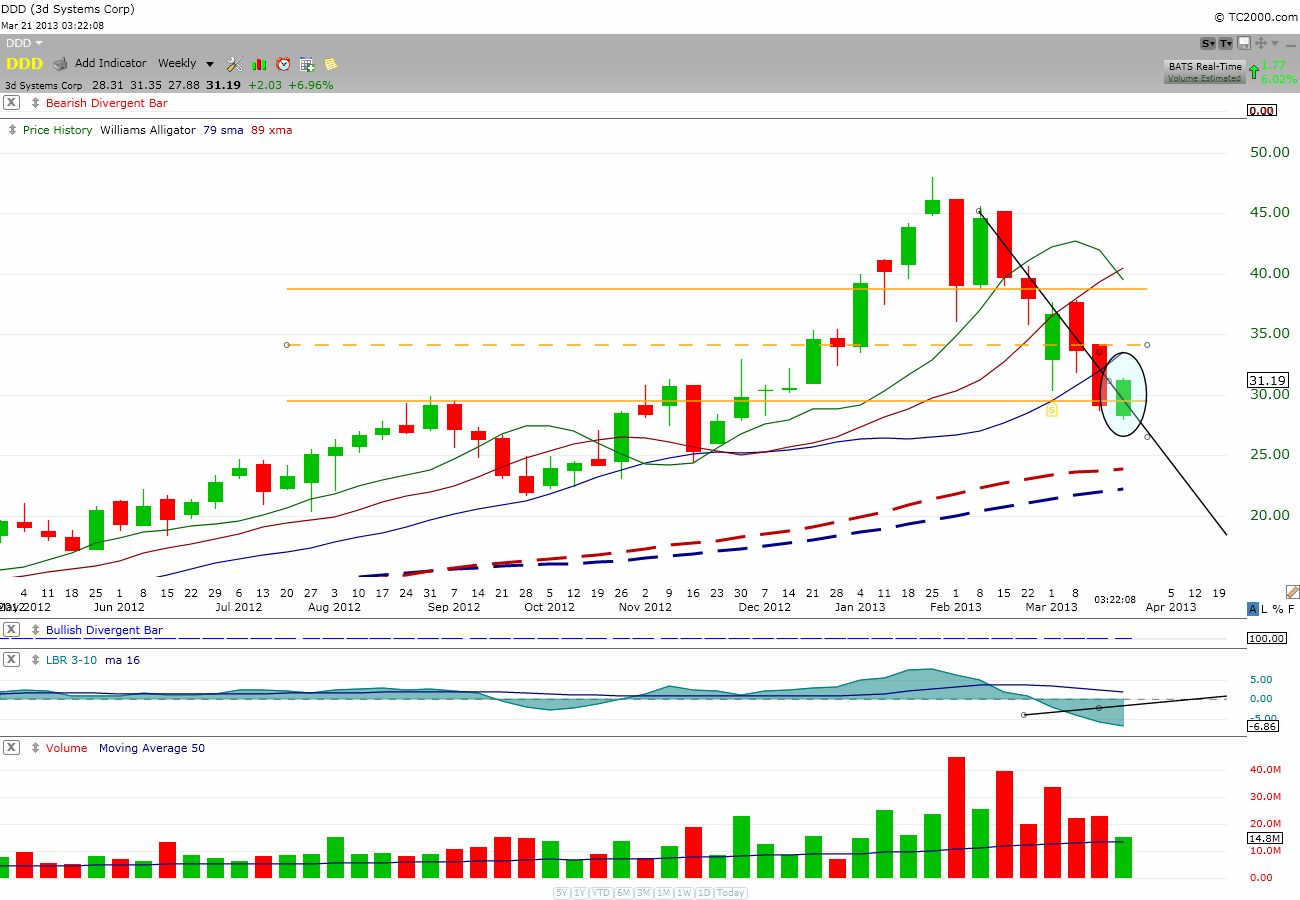
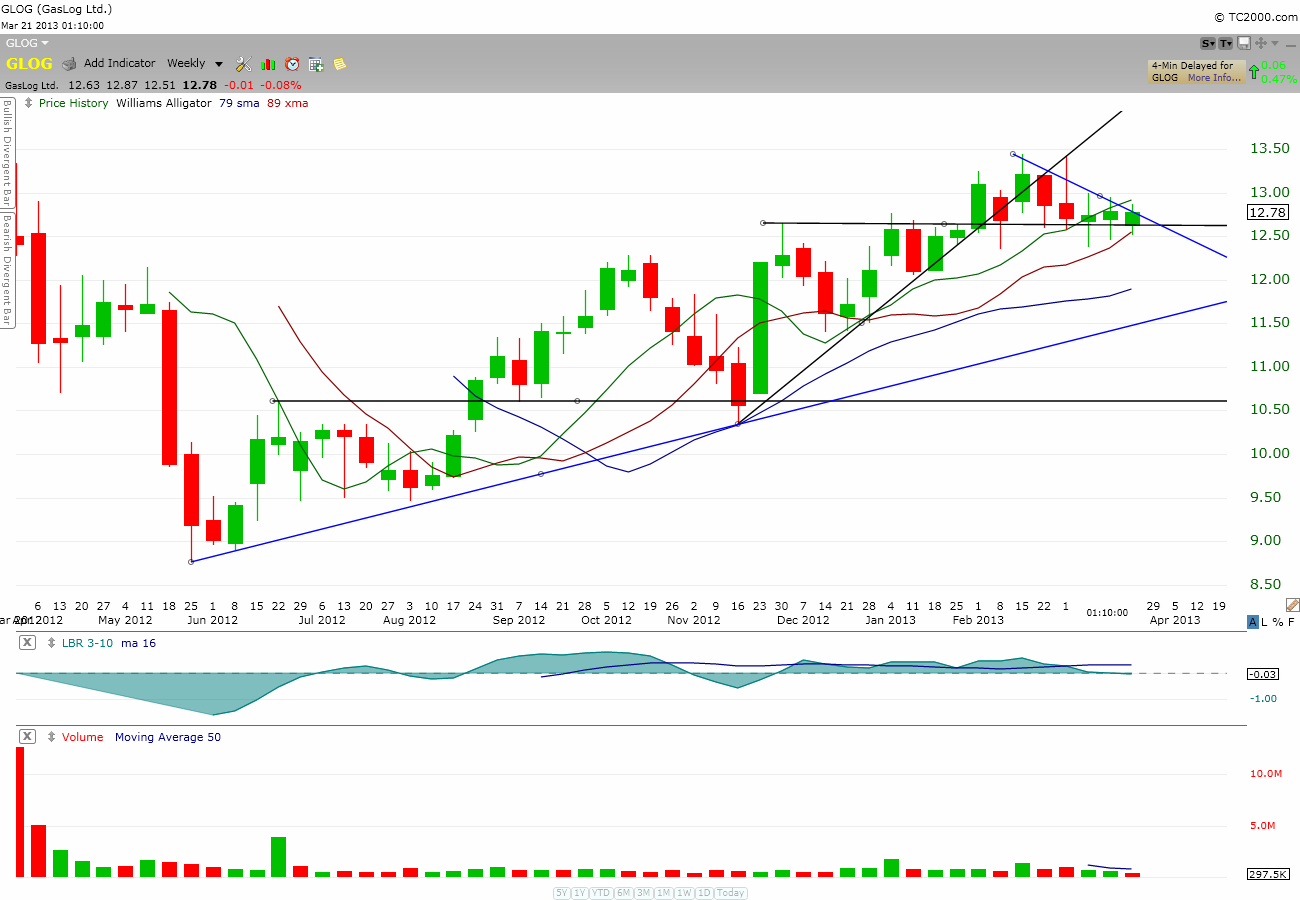
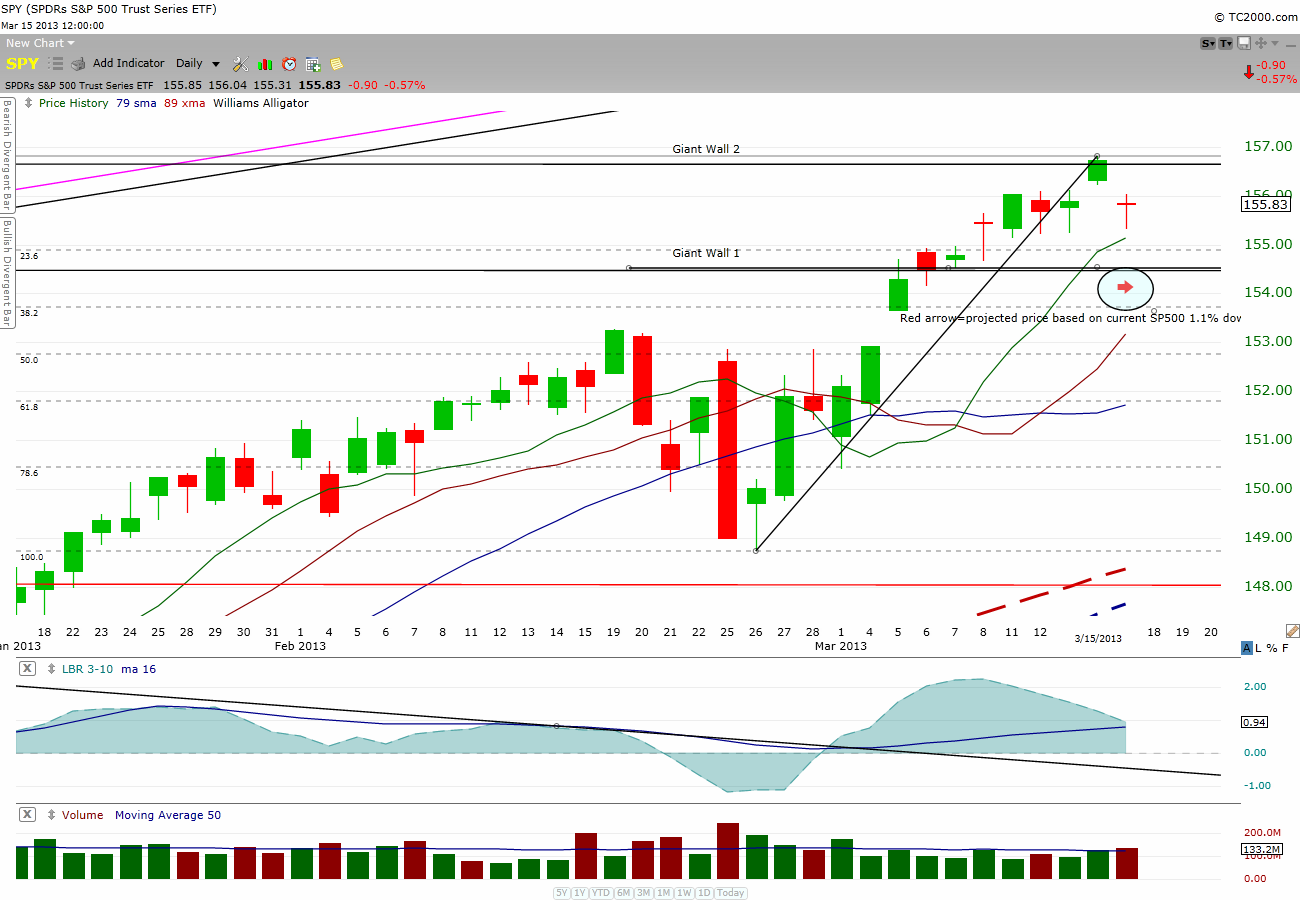
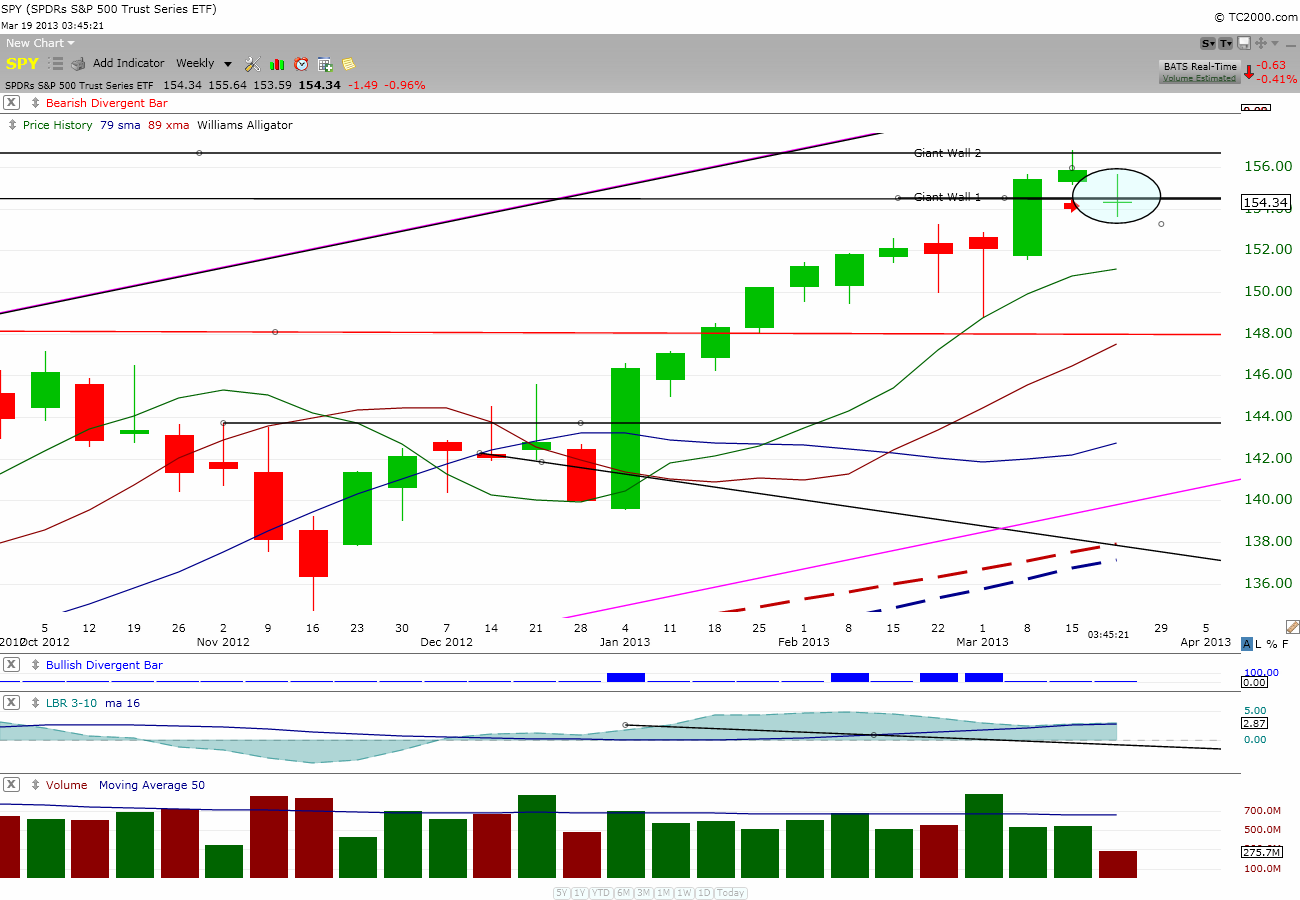
Well, look like the Bull may be able to come back on this one.  If you look at the SPY weekly chart below, we are forming a doji bar right at the Giant Wall 1 support.  In other words, the support is holding.

SPY_weekly

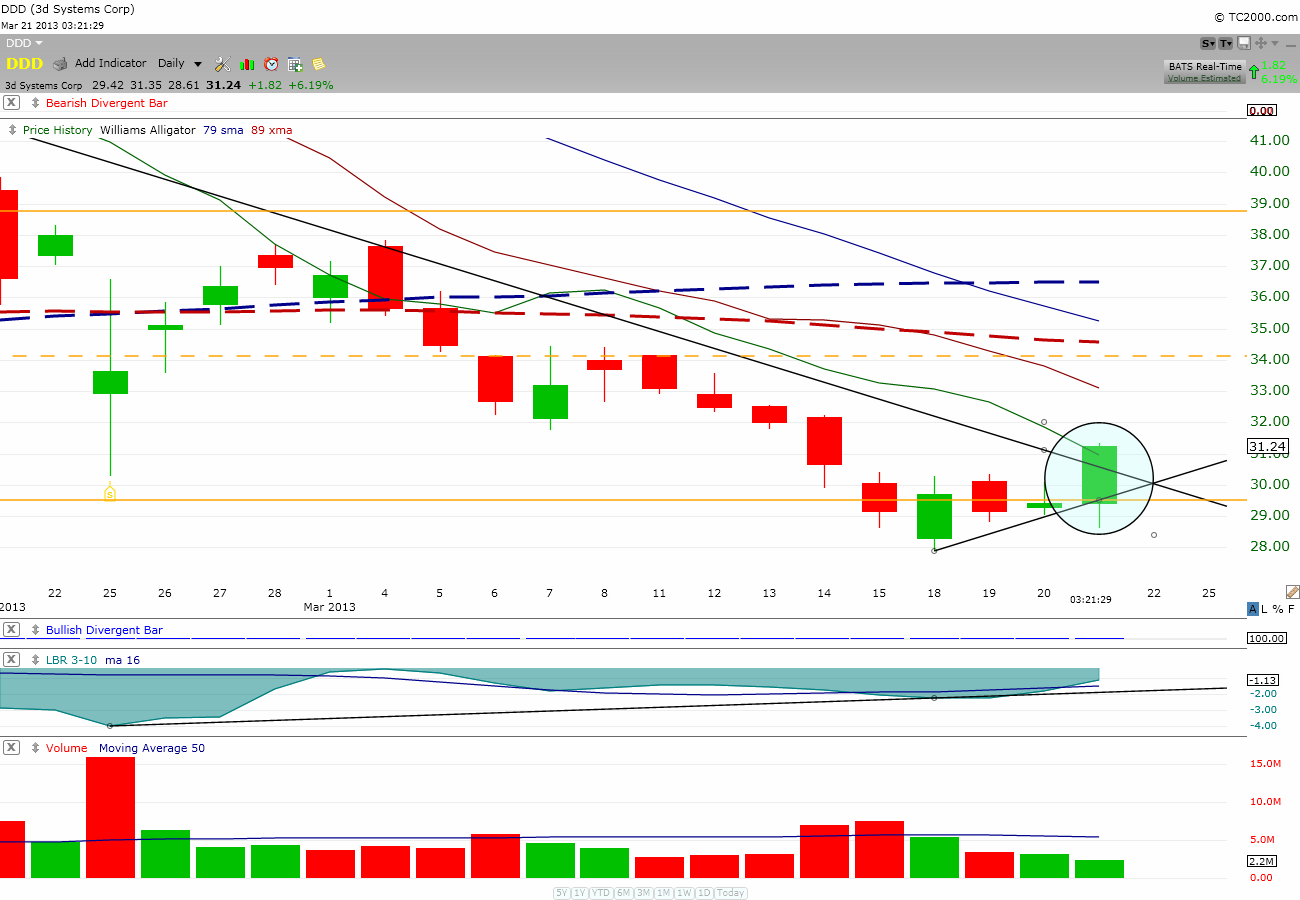
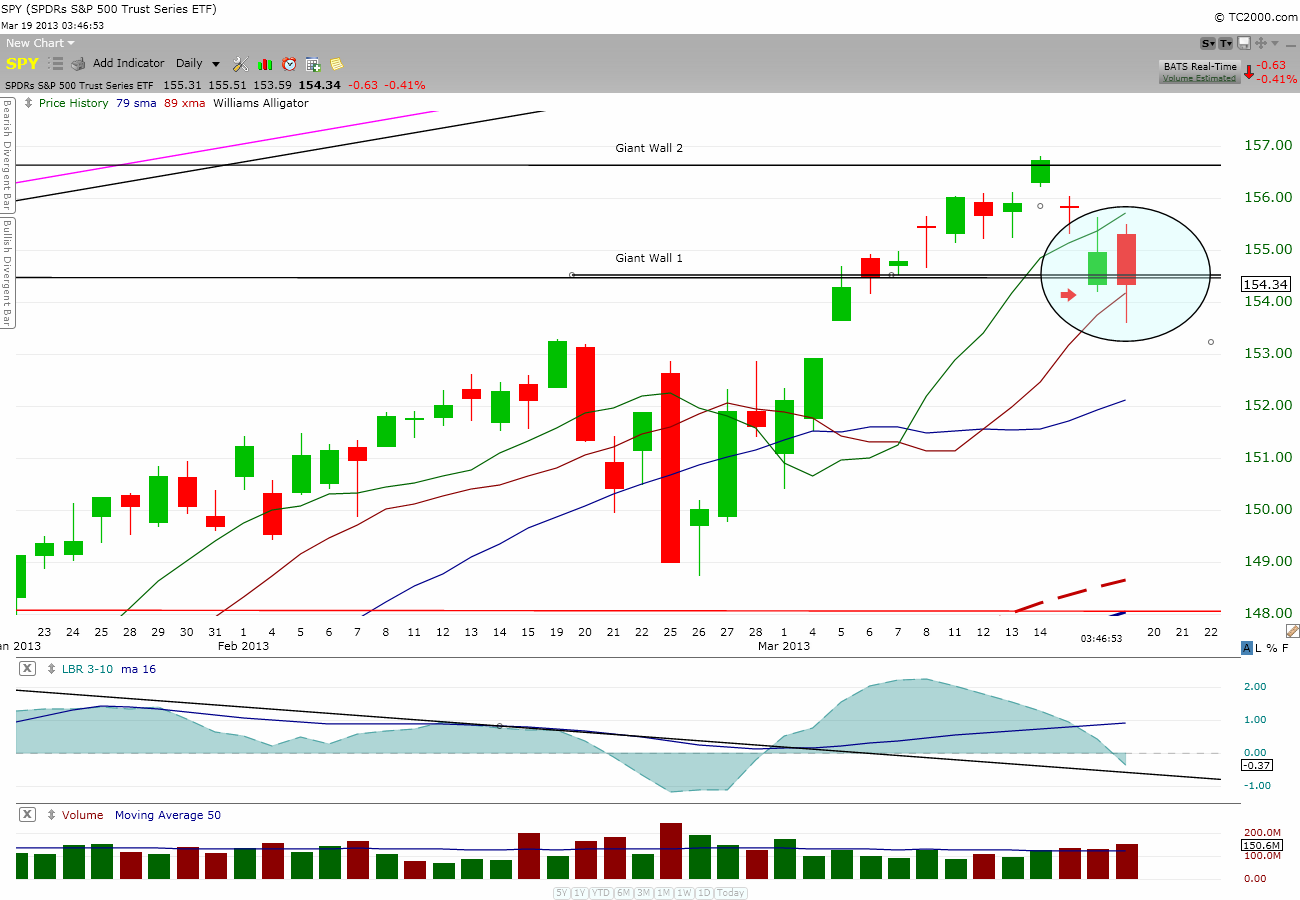
The daily chart below doesn’t look too bad either.  I like the longer tail at the bottom; this signify the bull is making a valiant fight back.

SPY_Daily

Zen out.

My 2 cents.


Comments »

The precognitive Doji strikes again!

Yesterday, I saw the doji formation on $PACB above the 79 & 89 moving averages; so without hesitation, I bought back $PACB.  I did not hesitate simply because when you have a doji formation at the bottom of a downtrend near a support area, the odd (or probability) of a turnaround is high.  No, it is not 100% but the odd is in your favor.  So, like a blackjack card-counter who sees that the undistributed cards are stacked with 10s, Jacks, Queens, and Kings, he starts to bet big.  In my case, I simply bought back my position.

I also added more in the early morning because of the upward bias.

Look at the beauty below:

PACB_daily

Notice that I’ve been cutting losses on $PACB during the previous downtrend to cut loss and yet here I am back on the saddle riding the rally up.  If this doesn’t convince you the value of cutting loss fast and the fact that cutting loss earlier doesn’t mean you will miss the boat (not all the times; but some of the times), I don’t know what will?

My 2 cents.

Comments »

Why Invest in Nanotechnology?

Below is the thesis from Harris & Harris Group, Inc. ($TINY).

***Notice that it was published in Spring of 2009.


Source: http://www.hhvc.com/docs/press-center/why-invest-in-nanotechnology-.pdf

Comments »

Here comes the bounce ($DCTH & $CUR)

The charts below convince me to buy back:

DCTH_daily


For $DCTH above, do you see how the price action is now staying above both two support lines.  There is still the catalyst of May FDA respond; so a possible rally still exists.

CUR_daily


I like the fact that price action is getting back on top of the down trendline.  Look like it is forming the 3rd wave up.  Remember, the 3rd wave of the Elliott Wave Theory is usually the longest wave of the five waves…

My 2 cents.

Comments »

You can’t help but be impressed with this morning comeback!

I’m duly impressed.

After selling some of my weak positions in the morning, I sat and watched to see if the bombs were still exploding here and there.  Surprisingly, the explosion began to die down and instead I heard roaring of the crowd.  For a moment there, I thought I was in the midst of a stock exchange hearing “buy! buy! buy!”.

With that kind of chanting, I’ve to buy something back as well!

I bought back $DNN (below what I sold for! High-Five!); $PACB, $BBRY.

I also bought $DCTH and $CUR (again!) because the price action looks like the bouncing is happening.

I added to $TINY.

Take a look at the daily $SPY chart below:

Price did not even reach my projected red-arrow price but instead proceeded to head up to create a nice green bar.  Isn’t that a beauty?  What I like is the fact that price action has immediately climbed back above the Giant Wall 1 proving that Wall 1 is indeud a solid support here.

SPY_Daily


My 2 cents.

Comments »

Giant Wall 2 resistance proves resilient

Just when we thought taking out the Giant Wall 2 (GW2) established back in October 2007 was a done deal, we are now getting slammed with another European conundrum.  S&P500 currently is printing a 17 points down or a negative 1.1% change.  Apply this 1.1% against the SPY’s close of $155.83 last Friday and we come up with $154.12.

If you look at the chart below, you can see the projected price of $154.12  (red arrow) is directly below Giant Wall 1 resistance ($154.94).   Notice that the 38.2% fib retracement is just a bit below the red arrow; it may mean some support there.

SPY_Daily

Can the Fed remedy this correction next week?  Will there be a huge rally waiting to burst thru the GW2?  Well, can it happens or are we simply exercising a self-fulfilling prophecy of topping out at major prior resistance?  Let’s not jump the gun yet; for price can still restore back to normalcy when market opens tomorrow morning   We’ve seen it happens before.  Until then, I’m going back to reading my book…

My 2 cents.

Comments »