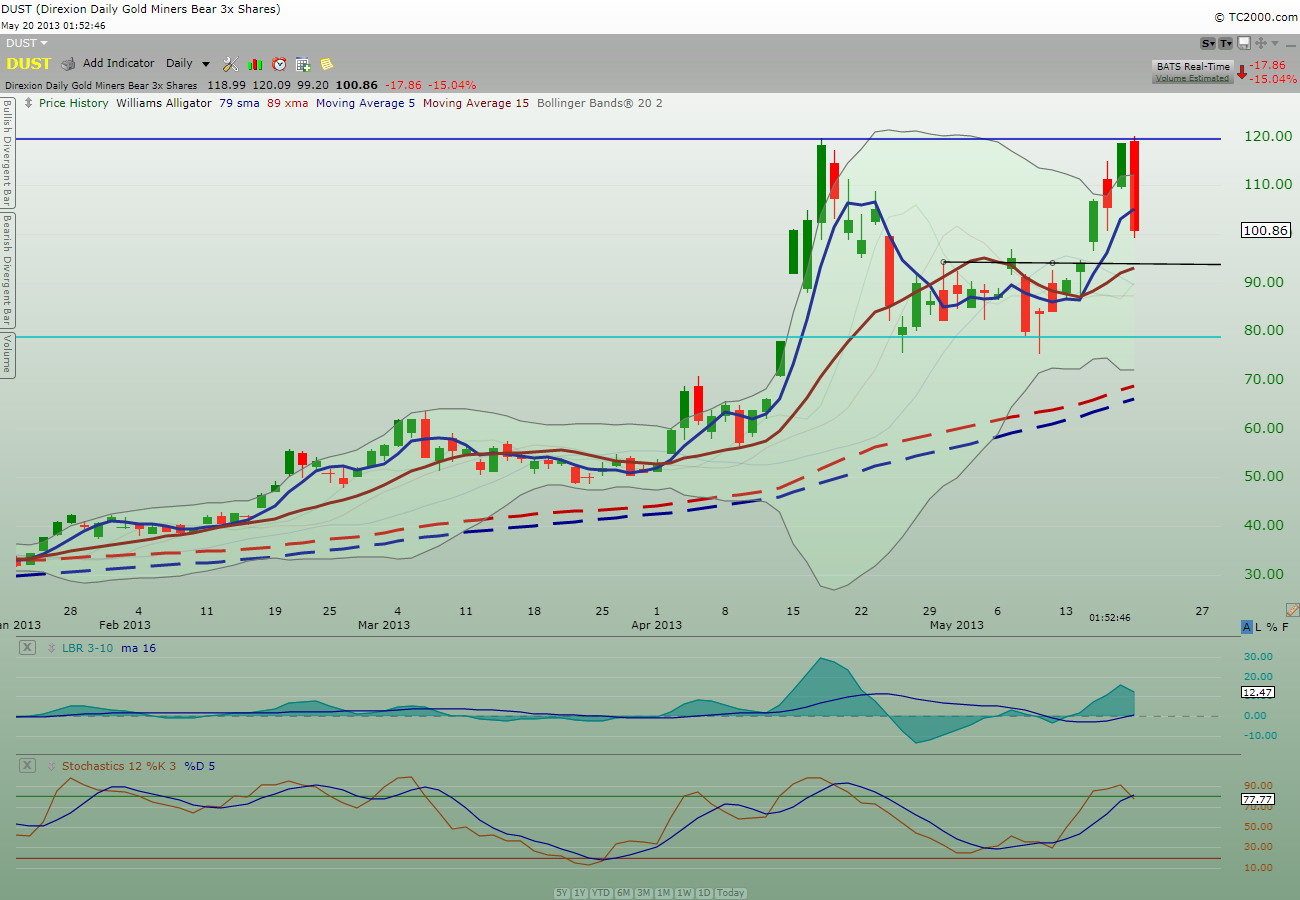
Did anyone see the double-top formation on $DUST?
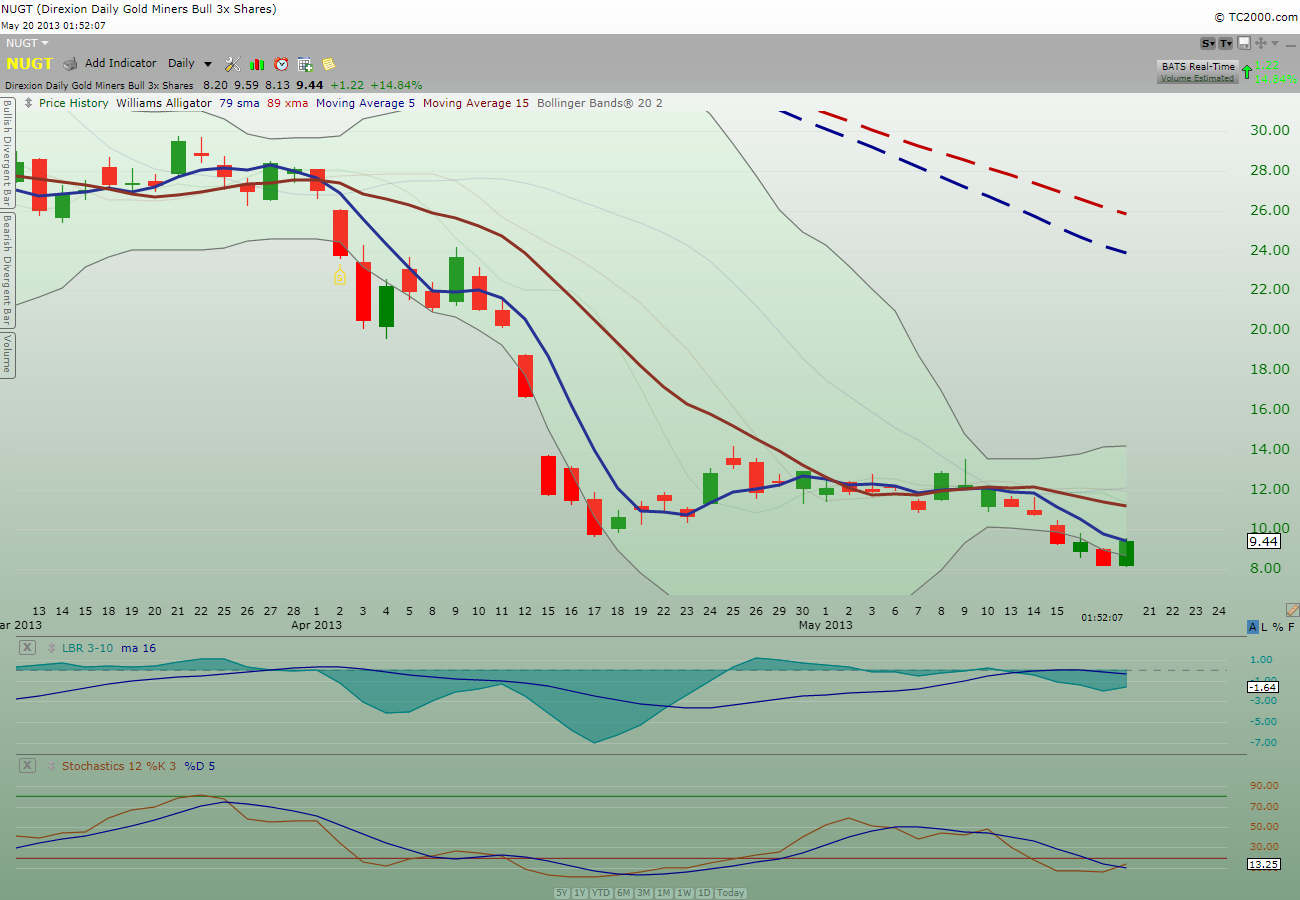
Seeing that $DUST price action was having a difficult time maintaining above the previous high of $119.63 from Apr 17th, I saw a low risk trade in $NUGT for a bounce.
Take a look at the daily $DUST chart below:
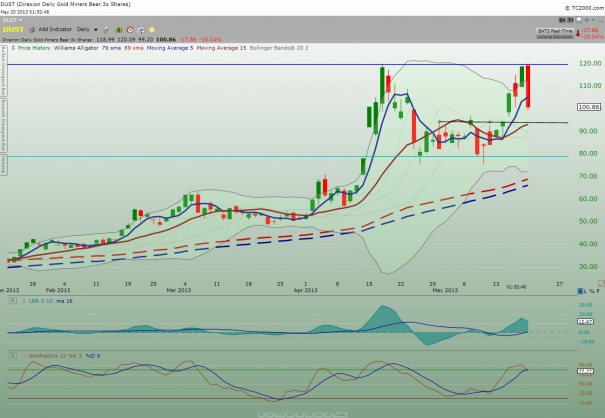
Chart is not looking healthy for the bull here. A severe double-top formation has formed with price action today taking out the low of the last two days.
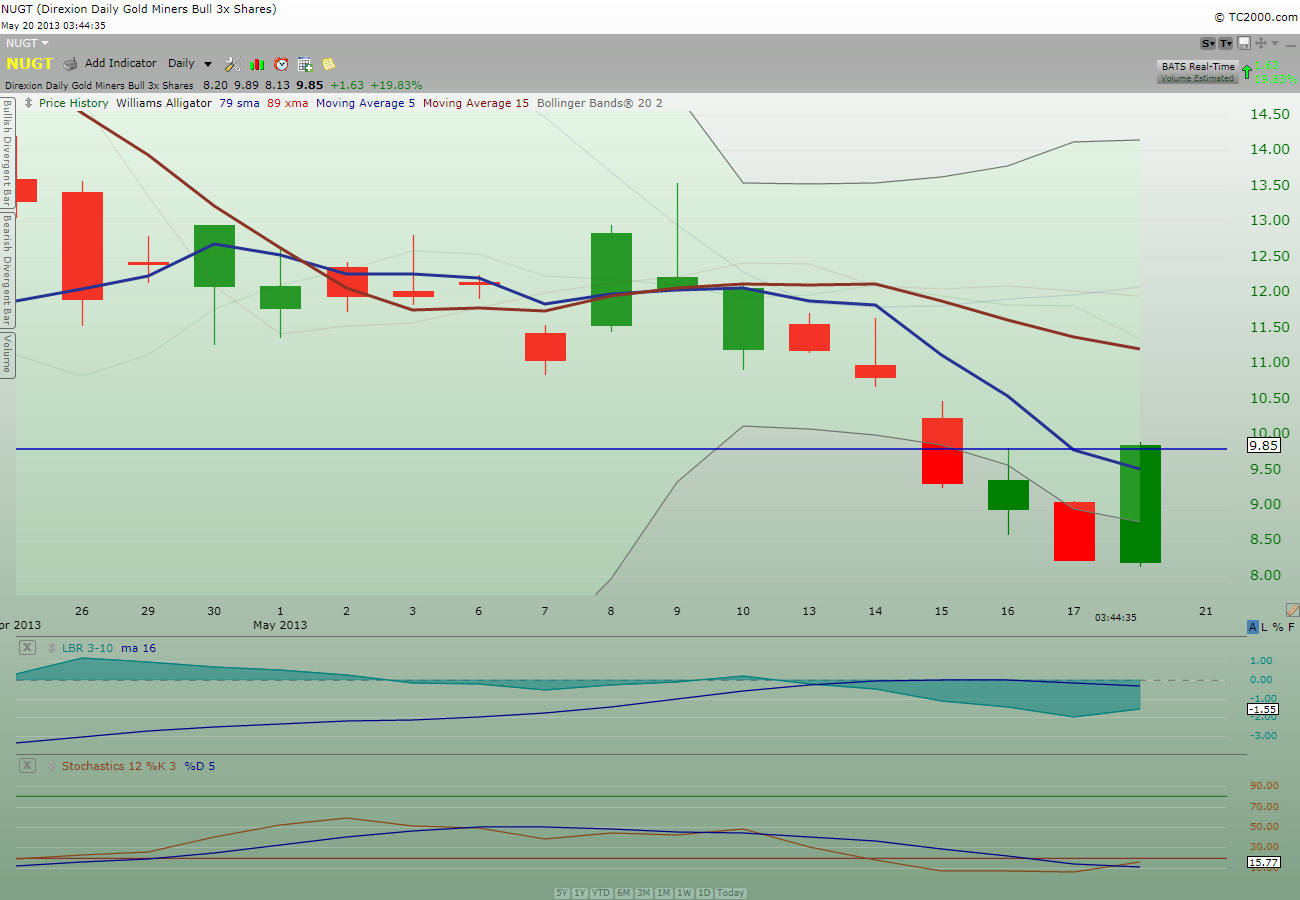
Take a look at the daily $NUGT chart below:
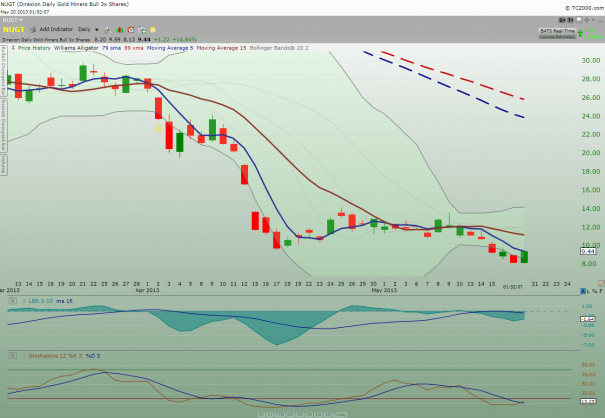
Although I was stopped out for a nice gain on $NUGT from the morning entry (with a low risk stop below intra-day low), I’m looking for a re-entry point with a low risk stop. Today candlestick bar is forming a bullish engulfment bar which can become a bottom bullish reversal pattern if price action confirms with an upside movement tomorrow.
My 2 cents.
@tradingmy2cents
The trades I made in $NUGT were time-stamped in twitter
Comments »