After a strong rally of 200+ points on the DJIA, I find myself 75% invested with 25% cash.
Well, duh! The good news is that today high took out the high of $143.55 in the week of 5/28/2008.
Take a look at the weekly SPY chart below: The next few trading days will decide if this May 2008 high will be a resistance to this rally or a support for further end-of-year rally.
Click here to see the large font version of this post

Currently, my biggest position is in AMRN (18% of portfolio).
To iterate, I like AMRN because of their recent FDA approval of their drug Vascepa for the treatment of very high trigylcerides (technical term for cholesterol). AMRN also has been receiving “allowance” for several patents out of the 25 they submitted. The speculation here is the potential take over by a major pharmaceutical company for a projected price of $20+ per share. Because any potential take-over news can be unexpected and sudden, I’m more inclined to give AMRN more room for the price action to jump around. I’ve been buying and selling AMRN since $12ish so I’m sitting in plenty of profit to cushion the volatility. But that doesn’t mean I want to give the profit back; nevertheless the reward for a takeover announcement is more than justifying the risk I’m taking.
Below is the daily chart of AMRN. Notice the inside green candlestick bar. I see this has a bullish stance even though it is not a full Harami candlestick formation which required the previous red bar to be at the bottom of a downtrend.

My 2nd large position is in GLOG (14% of portfolio)
LNG (liquefied natural gas) is here to stay and it is not going away. Foreign countries will want a lot of cheap LNG from the US and GLOG has the ships (and more new ones to come next year) to handle the extra volume. I’m also inclined to give this one more room to gyrate around since I’m betting the price to increase gradually as we come close to the launching of the new ships in early 2013.
Below is the daily GLOG chart. Notice today formed a doji candlestick bar after 4 down days. A doji after some correction may be a signal for a bottom and a possible reversal.

The rest of my portfolio, in order of size, are the following:
LT equity; SYZM, NFLX, EXEL, FOLD, DNN, CCJ, DVAX, and NPSP.
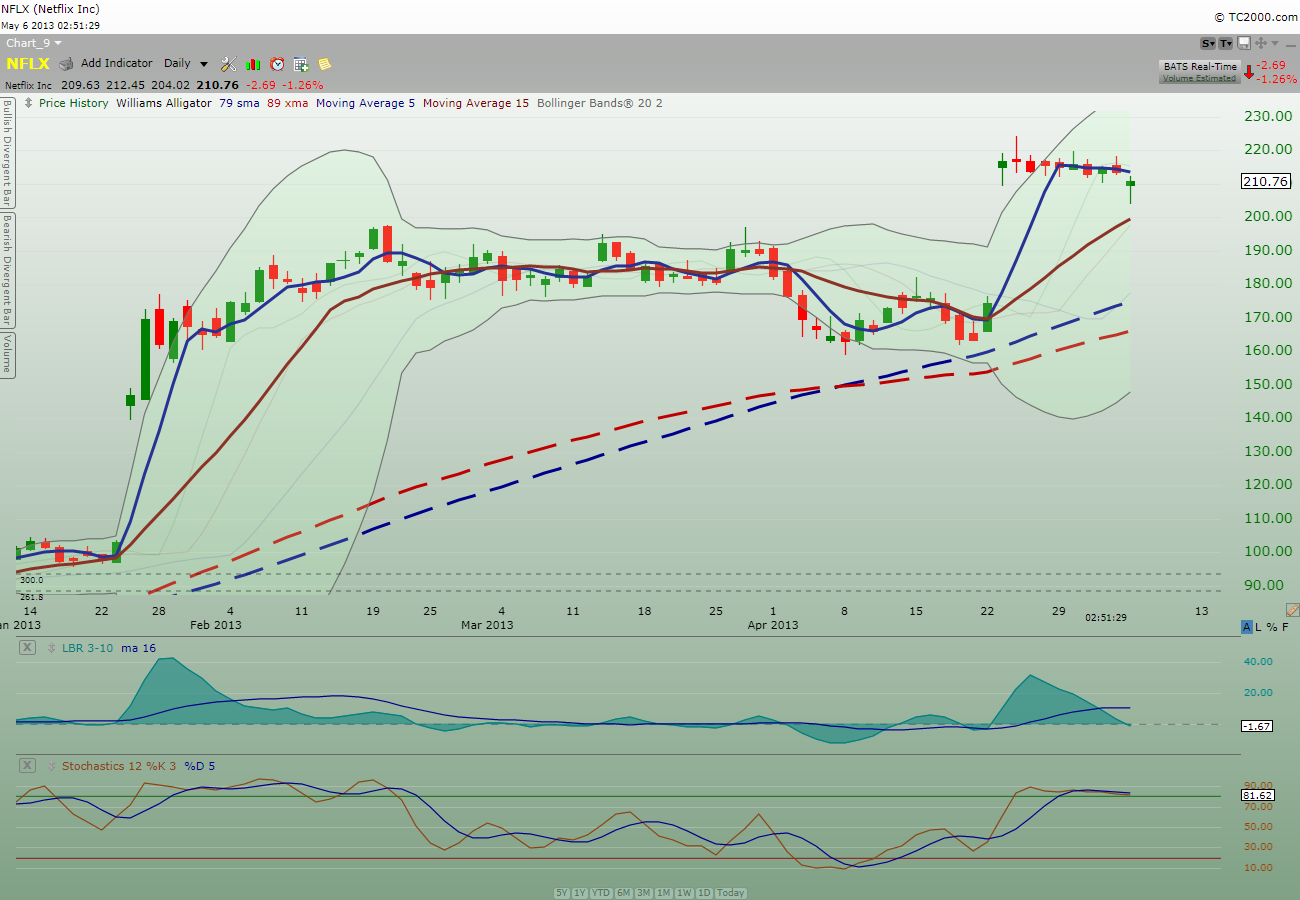
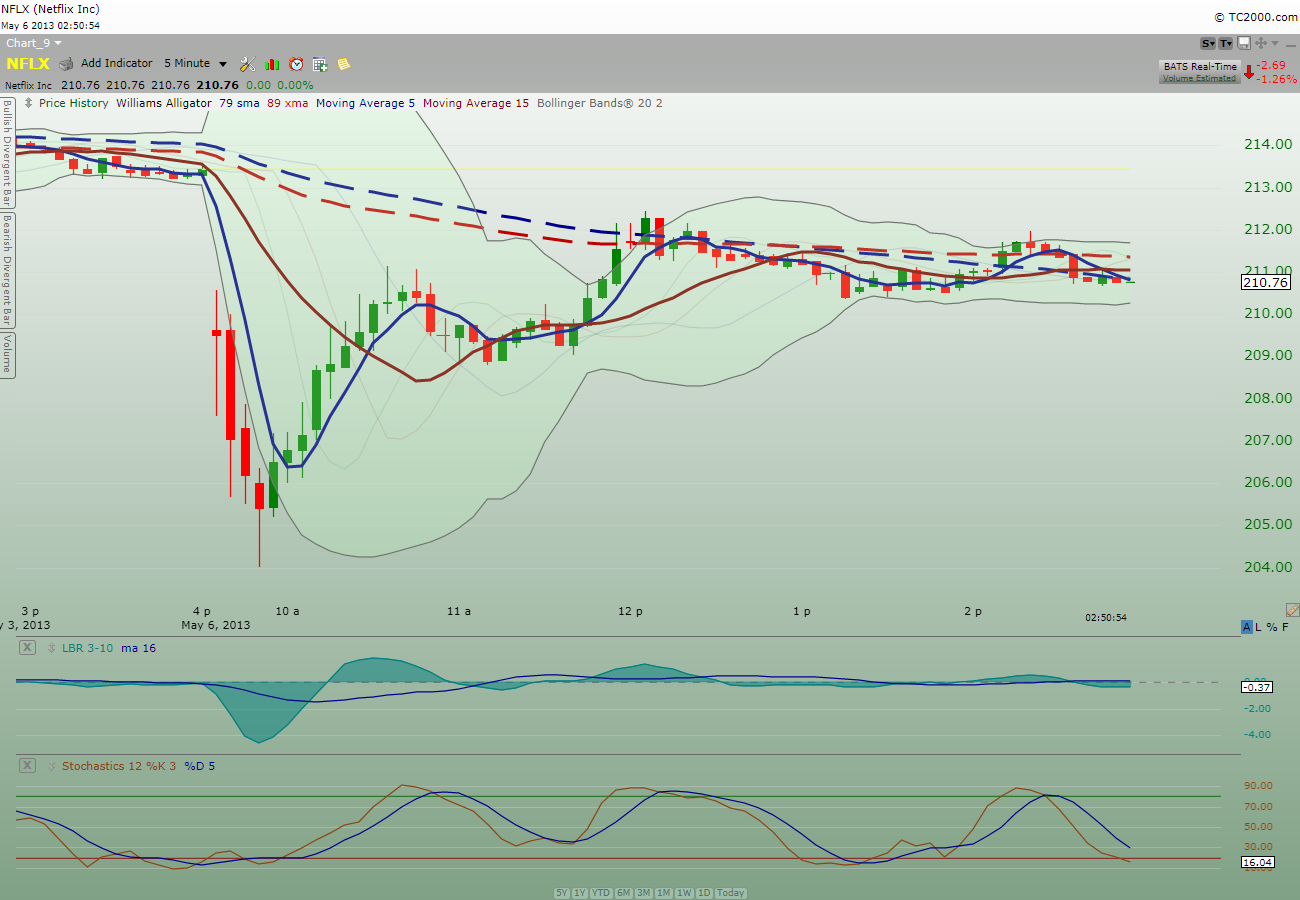
I bought The Fly’s pick on NFLX because the daily chart of NFLX today has a very nice bullish reversal setup and also a double bottom b/w early August and this week. Besides my risk is low since my stop will be below the low of Sep 4th.

Remember to follow the price action!
Click here to see the large font version of this post
Comments »