Not with Amazon breathing down their neck.
Look at the daily $BKS chart below:
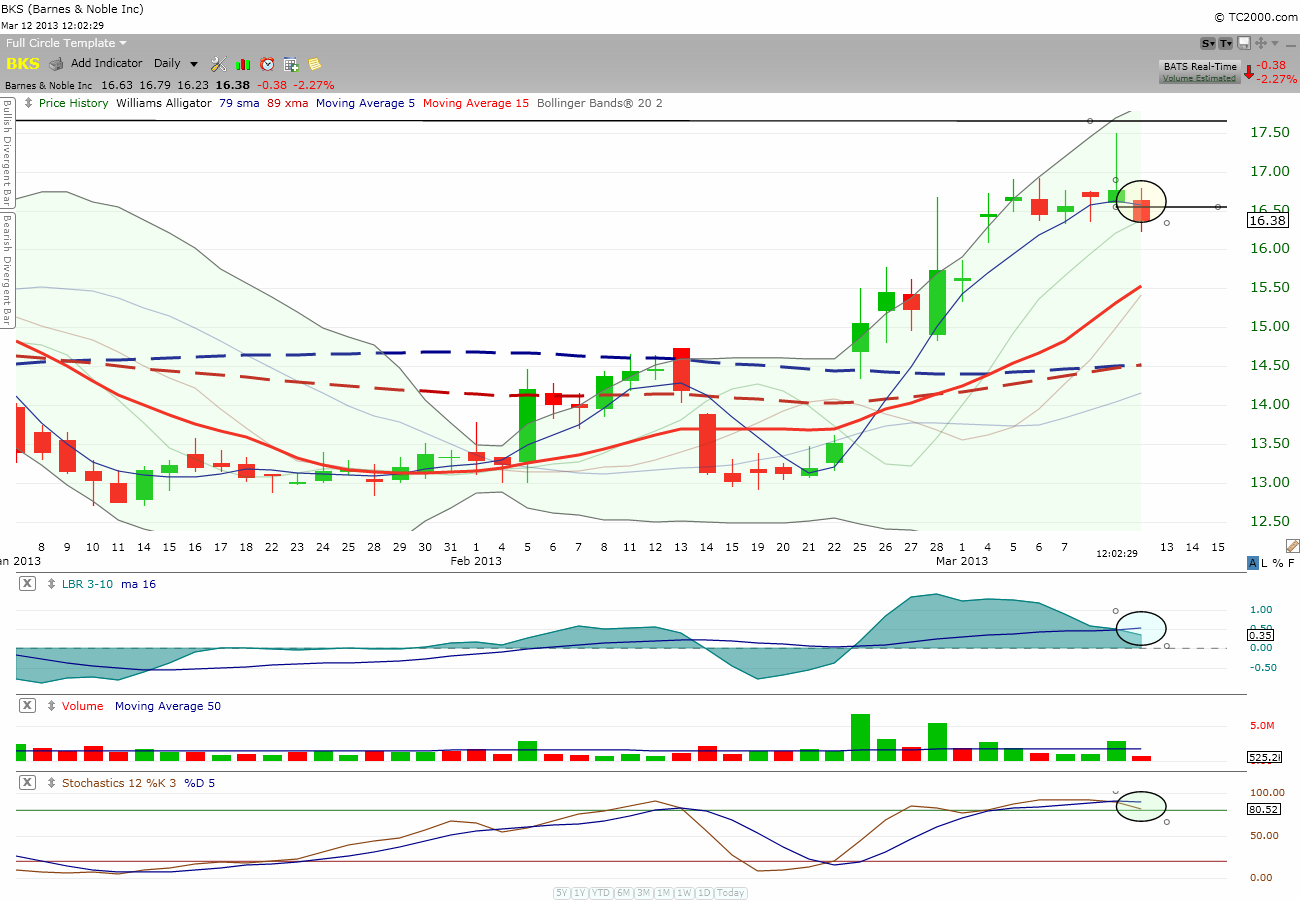
Price action took out the low of the inverted hammer (or shooting star) candlestick pattern from yesterday; in my book, that is a good short.
Did you see how two of the momentum indicators turned south?
I sold (short) a starter position on $BKS today with a stop above yesterday high.
My 2 cents.
Comments »