iBankCoin
Don't pay dollar to keep 2 cents when wrong. Cut your losses quickly. Trade what you see, not what you think.
Joined Oct 26, 2011
719 Blog Posts

Breakout in session

I bought $MELA at open because it took out the resistance from early March and I continued to add as price continued to climb.

Take a look at the daily chart below:

MELA_daily

Now, take a look at the weekly chart below:

MELA_weekly

The weekly chart should give you the potential of this movement giving the fundamental of this stock, IMO, is lining up the duck so to speak.

Below is the business profile of $MELA from Yahoo Finance:

Business Summary

MELA Sciences, Inc., a medical device company, designs, develops, and commercializes a non-invasive point-of-care instrument to aid in the detection of melanoma. The company’s principal product, MelaFind, consists of a hand-held component that employs high precision optics and multi-spectral illumination; a proprietary database of pigmented skin lesions; and lesion classifiers, which are mathematical algorithms that extract lesion feature information and classify lesions. Its hand-held component emits light of multiple wavelengths to capture digital data from clinically atypical pigmented skin lesions, which is then analyzed utilizing classification algorithms trained on its proprietary database of melanomas and benign lesions to provide information to assist in the management of the patient’s disease, including information useful in the decision of whether to biopsy the lesion. MELA Sciences, Inc. offers its product to dermatologists. The company was formerly known as Electro-Optical Sciences, Inc. and changed its name MELA Sciences, Inc. in April 2010. MELA Sciences, Inc. was founded in 1989 and is based in Irvington, New York.

—–

My 2 cents.

This is not a recommendation to buy but simply my documentation of why I bought this stock.


Comments »

Today Portfolio Adjustment (04-25-2013)

Today was a sit on your hand day.

Market opened up and my focus was immediately on $GLUU since $ZNGA gapped down from earnings report.  After a few minutes, I decided to sell $GLUU for losses in case price decided to do a waterfall style and I didn’t want to tie up my focus on $GLUU when I should be looking at other stocks.  Later, when $GLUU started to climb back up, I decided to jump back in and paid a premium for it.  Oh well, if $GLUU could take off from here, the premium I paid now would be a small token.

Since there were so many talk about solar stocks coming back into the limelight, I decided to look at $YGE which was an alert from RaginCajun.  I also traded $YGE long time ago so it was natural for me to pick $YGE as the solar play.  Chart looked good and I bought a starter position.

$BCRX was taking heat all day due to failure to foll0w-thru with yesterday big momentum day.  By the last hour of the trading day, I decided to reduce the position size to adjust my risk profile and to cut losses.

Seeing I was sitting on a very nice gain on $SZYM, I was getting a little concern about a late profit-taking coming later to erase my gain.  So I decided to take some profit first and see what happened later.  What happened later was that instead of profit-taking, there were more buyers coming in to rally the price further.  Seeing that I was wrong, I immediately jumped back in and bought back the shares I sold earlier.  And at price continued to rally toward the close, I bought some more.  Now I’m holding more shares than this morning before open.  Yes, I paid a premium to buy the shares back.  That is the price I’ve to pay for playing safe.

Seeing $RBCN gunning for a late run into the close, I added more shares.   I like to hear the squeaking sound from the shorts…

The charts on $CHK and $WPRT were doing a downside reversal later in the day and I decided I didn’t want to waste time managing these two stocks anymore; therefore, i sold $CHK at breakeven and $WPRT for a small gain.

I need to learn how to sit on my hands more so that I don’t have to pay premium to buy back stocks like $GLUU and $SZYM.  But my internal urge for safety can be very overwhelming sometimes.

Oh, btw, $AMRN did not take out yesterday low, so I’m content to continue to hold on to my swing trade position I added yesterday.

Current holdings:

AMRN, LRAD, SZYM, TINY, RBCN, GLUU, DNN, BCRX, PPC, YGE and 27% cash.

@tradingmy2cents

The trades I made in the journal were time-stamped in twitter

Comments »

Nanotechnology – our emerging tech to replace science fiction

I’ll let the charts tell the picture.

Below is the weekly chart for $PXN (ETF for Nanotech)

PXN_weekly

Below is the weekly chart for $TINY

TINY_Weekly

Notice price was bouncing off the floor.

Below is the daily chart for $TINY

TINY_daily

There are the usual resistance; but in time, you cannot avoid the emerging of the nanotechnology to change every aspect of our technological life.  There is a new tech world out there that will bring science fiction into reality sooner than we think…

Disclosure: $TINY is in my long-term position portfolio.

My 2 cents.

Comments »

Today Portfolio Adjustment (04-24-2013)

Today was a happy shopping day.

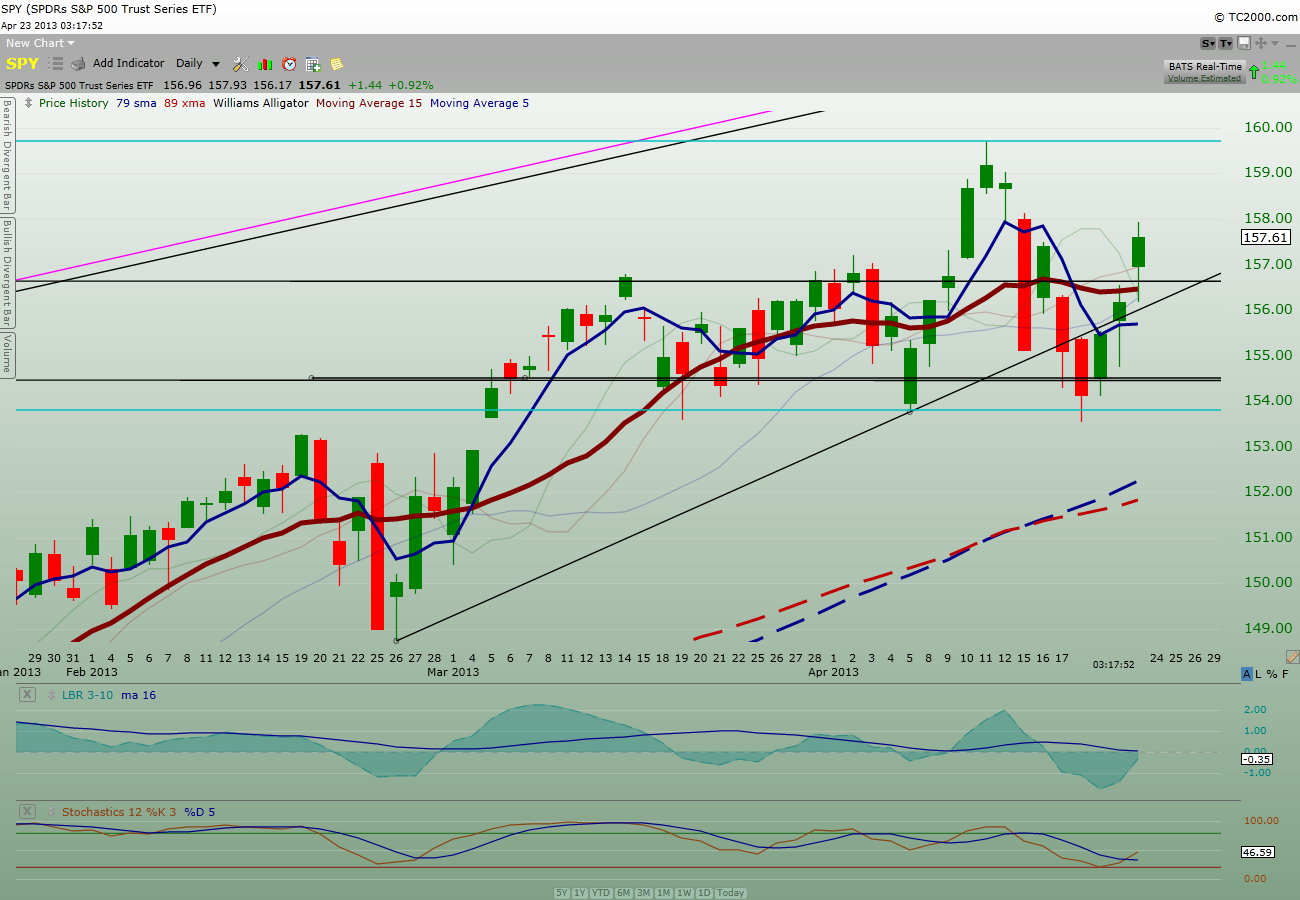
Market opened positive but slid into yoyo action b/w positive and negative during the first few hours.

Meanwhile, my first order of business was to watch $AAPL.  I had my position that turned from a healthy profit after earnings announcement into a loss before market open this morning.  Instead of dumping at market open which is my usual MO, I decided to wait and find a point to put my stop loss below overnight or intraday low.  Lo and behold, $AAPL took off after a few hiccups and I immediately moved my trailing stop along so as to protect myself from any sudden downside reaction.  Luckily, price continued upward and I used the 3min chart to guide me on the trailing stop.  By the time I was stopped out, not only did I not have to take a loss but ended the day taking home a decent profit.  Afterward, I left $AAPL alone because this stock still has issues for people to deal with.

$AMRN was my other stock I was keeping a close look because I bought add’l shares for my swing trade yesteraday and I didn’t want it to exacerbate my current drawdown.  Unfortunately for me, prices continued to head south so I dumped my swing trade position plus some that would reduce my core position by 30%.  I then watched $AMRN to settle down on the falling prices.  When it looked like it was about to bounce, I pounced back in.  I bought back my 30% and later on added more at price seemed to stabilize.  Yes, there are shares that are meant to be swing trades in the portfolio.

I moved my stop on $GLUU to breakeven since price took out half-way point of yesterday bar.  I was stopped out.  Later, when prices looked bouncy, I bought back half the shares.  Near the end of day, prices were showing strength so I bought back the other half I sold earlier plus some.  I added more because today recovery strengthened yesterday breakout pattern.

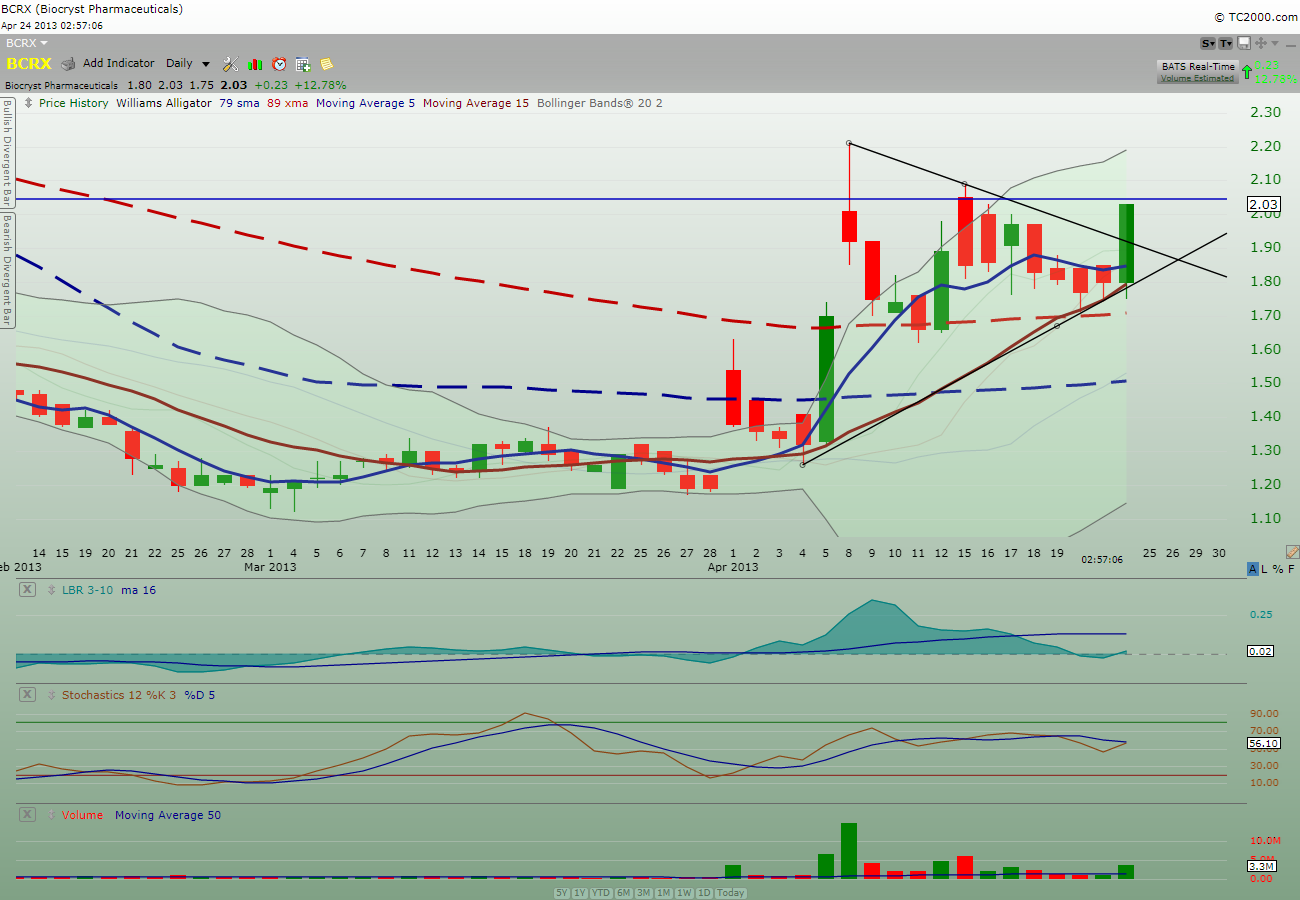
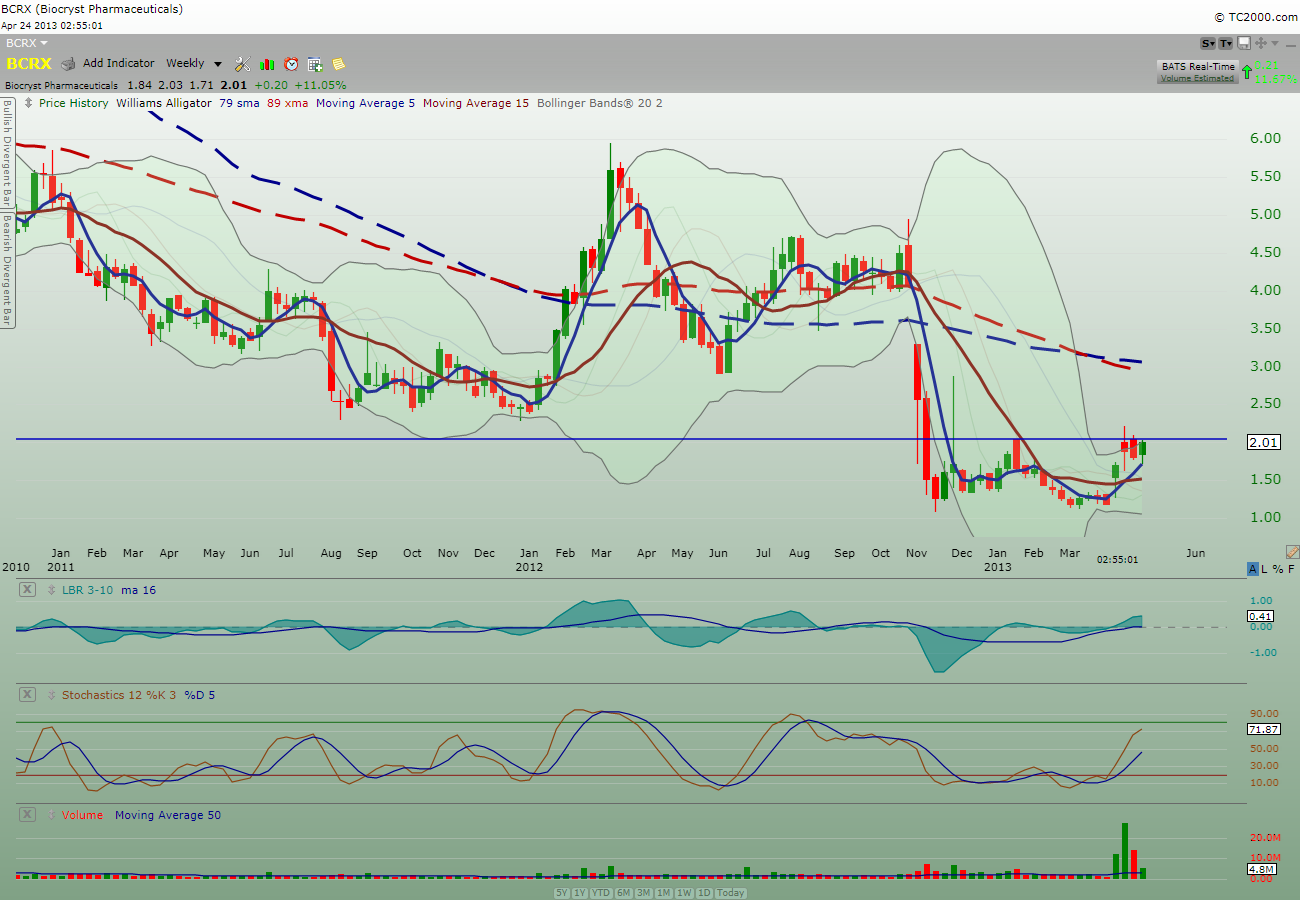
While watching $AAPL and $AMRN in the early morning hours, I also paid attention to $BCRX.  Although price action had not taking off at the time I was watching it, I sensed the underlying energy behind $BCRX and I just had to buy it.  Without hesitation, I bought some and when prices started to move, I added more.  I kept on adding until I got to the position size I wanted to be in.  I didn’t hesitate because the chart looked mighty good on the symmetrical triangle breakout.

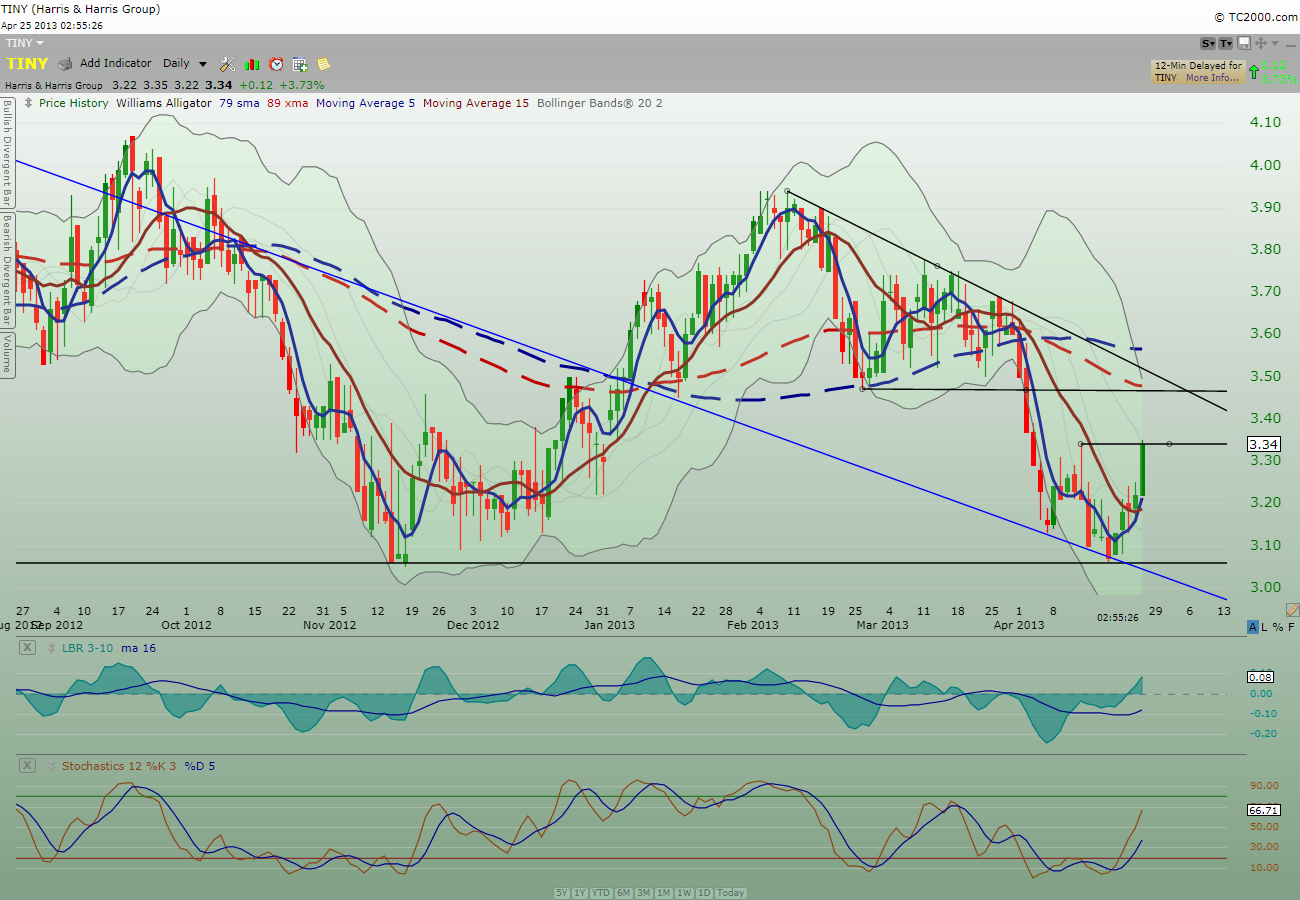
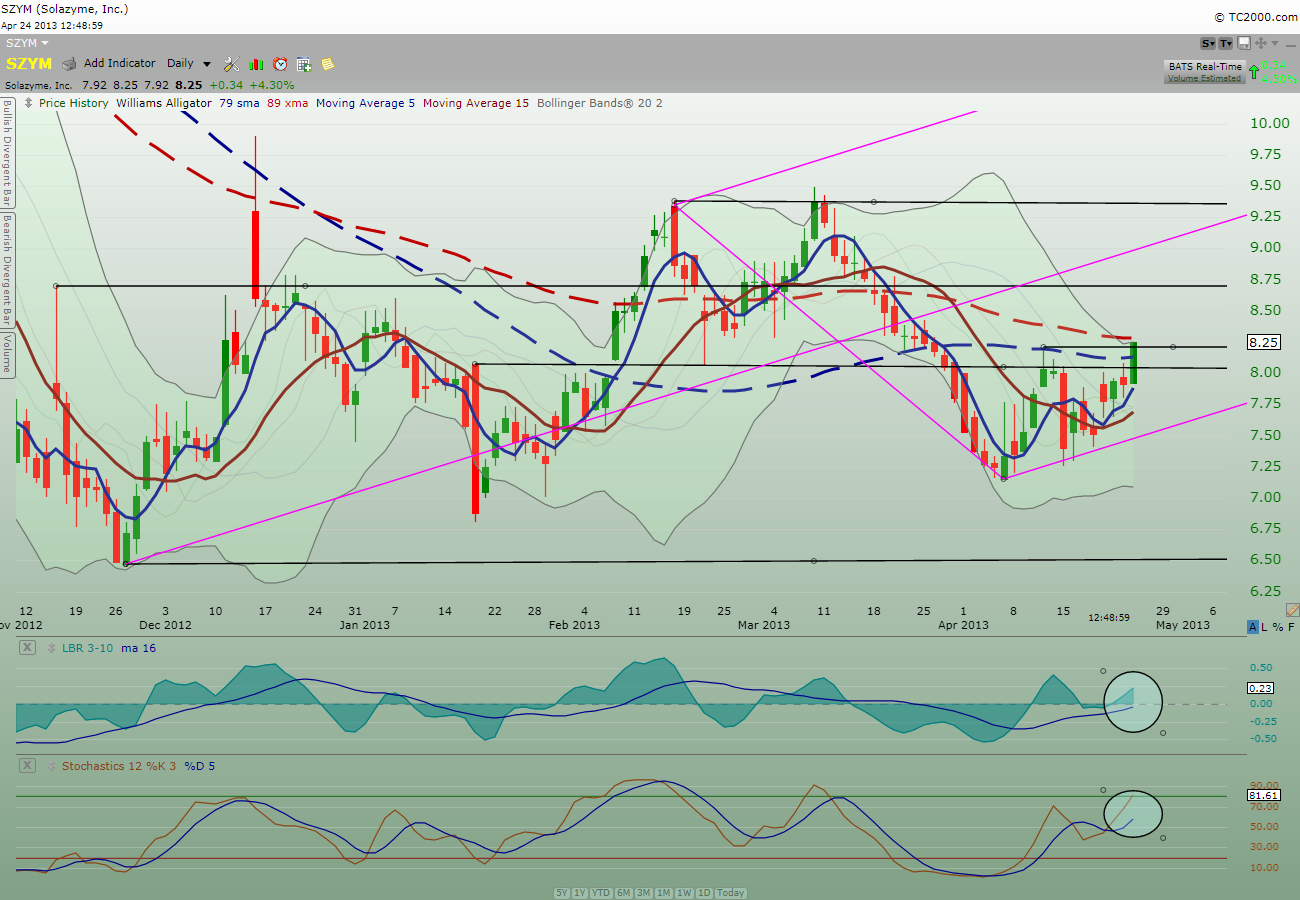
Meanwhile, I was happy to see $SZYM price action staying above the $8 price support.  As price continued to struggle b/w $8.08 and $8, I continued to watch.  The next time price get near the $8.08 again, I added to my $SZYM position.  Price did not start the strong rally then but I l was too occupied with other stocks that I left it alone.  Lo and behold, $SZYM turned out later to be one of the strongest stock to rack up a nice percentage gain (the other two are $BCRX and $RBCN).  I was glad to add $SZYM.

I saw $CHK chart and price action broke out of the downtrend line so I bought a starter position.

Later, I also bought $WPRT to complement my purchase of $CHK.

Seeing $CCJ had a strong rally, I decided to buy $DNN instead since it has a tendency to run faster than $CCJ.

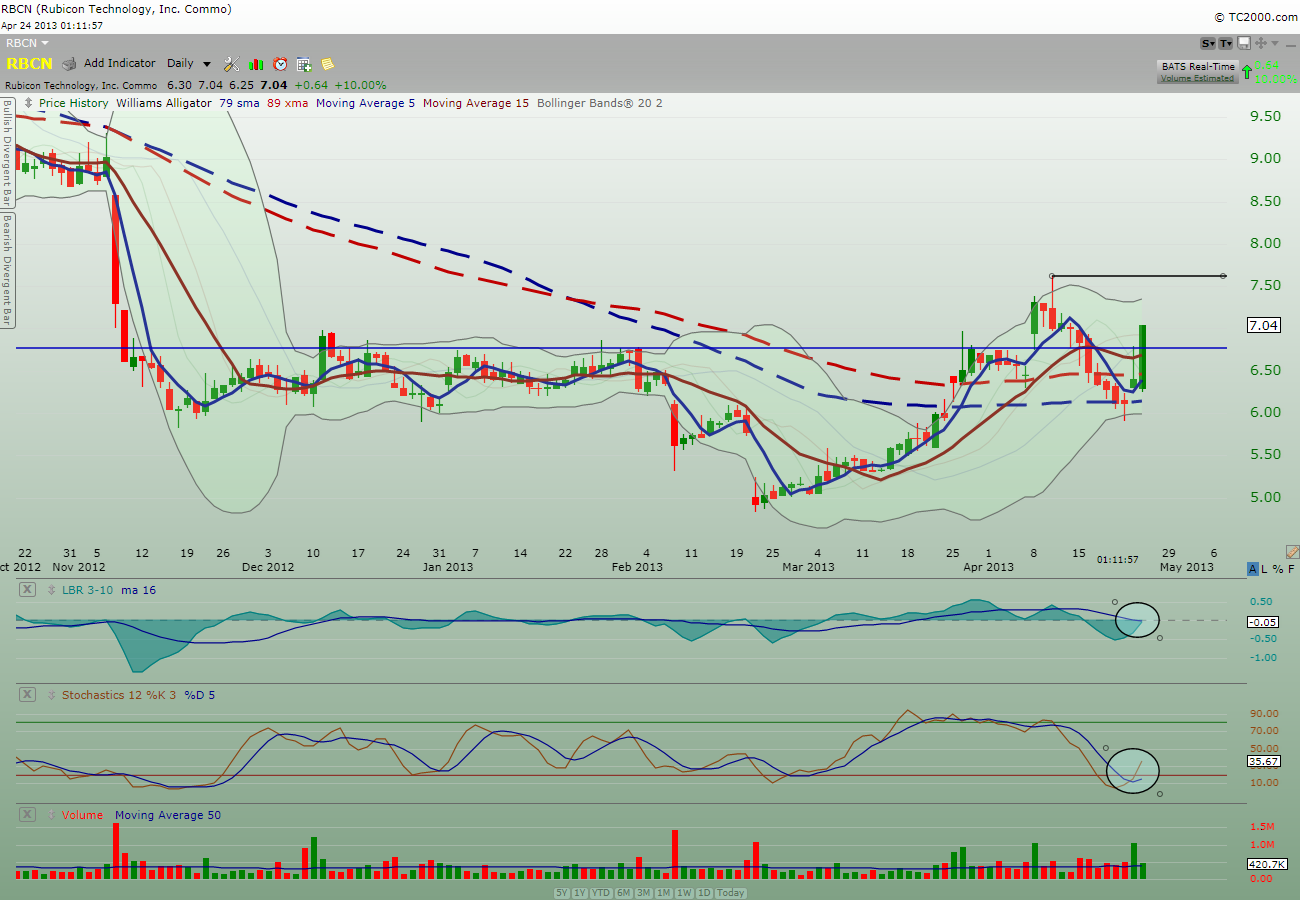
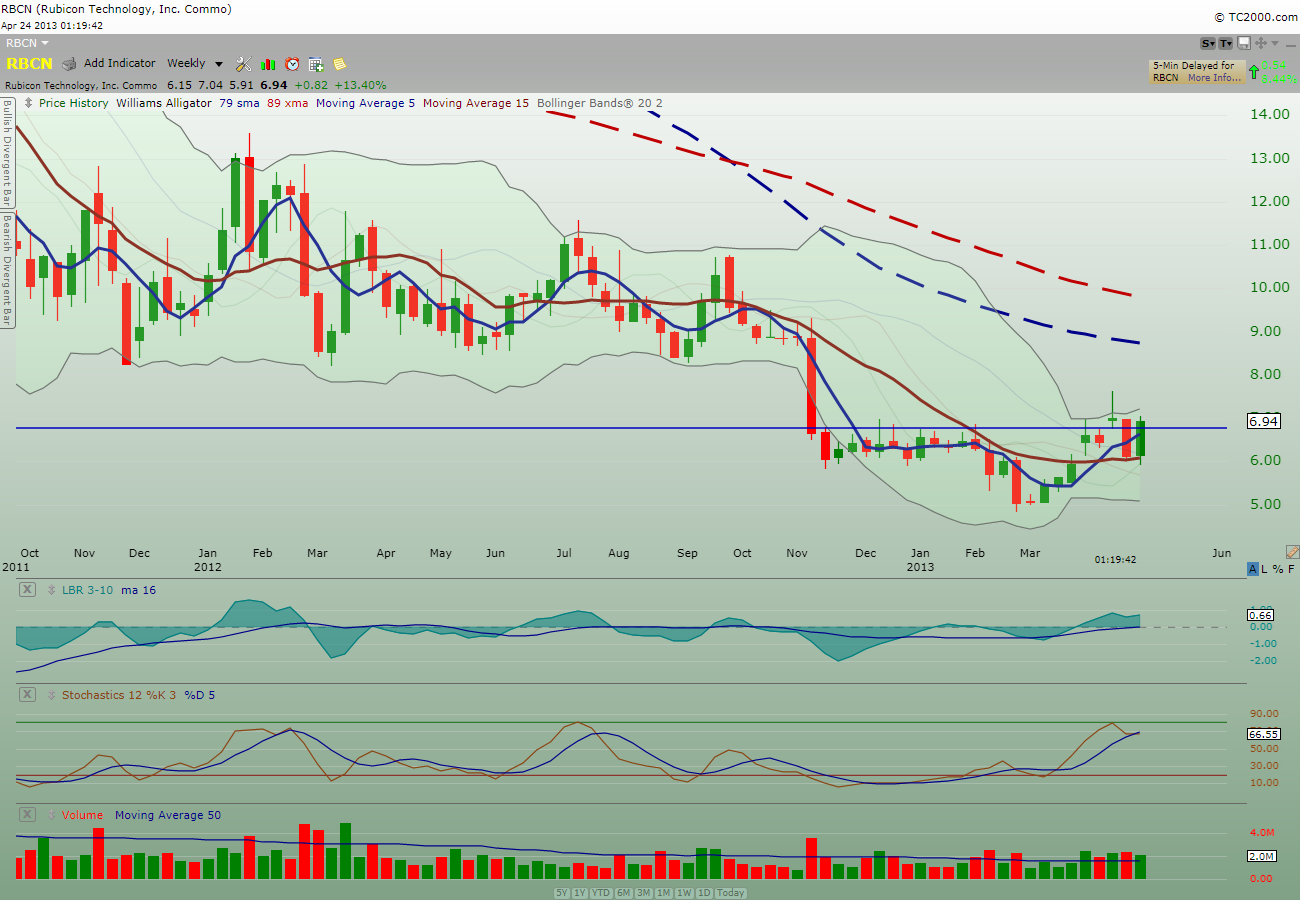
I saw The FLY post on $RBCN and decided to look at the chart.  I like what I saw and bought a starter position.  Later on, seeing that prices weren’t retracing much, I decided to add more instead of waiting around for a cheaper price.

Vertigo alerted me again on $PPC and after watching it a bit, I decided to buy a starter position.  The size is smaller than the first time I bought not too long ago.  I wanted to see if there is any follow thru before adding more.

All in all, today is a good day for my portfolio with $SZYM and $BCRX gaining a lot of ground for me.  Because I got in late on $RBCN, I will have to wait for follow-thru price action to rack up gain.  I’m satisfied with my new $AMRN position size and look forward for price action to bottom out from here so I don’t have to pare down my position size on $AMRN to get rid of the swing trade.

Current holdings:

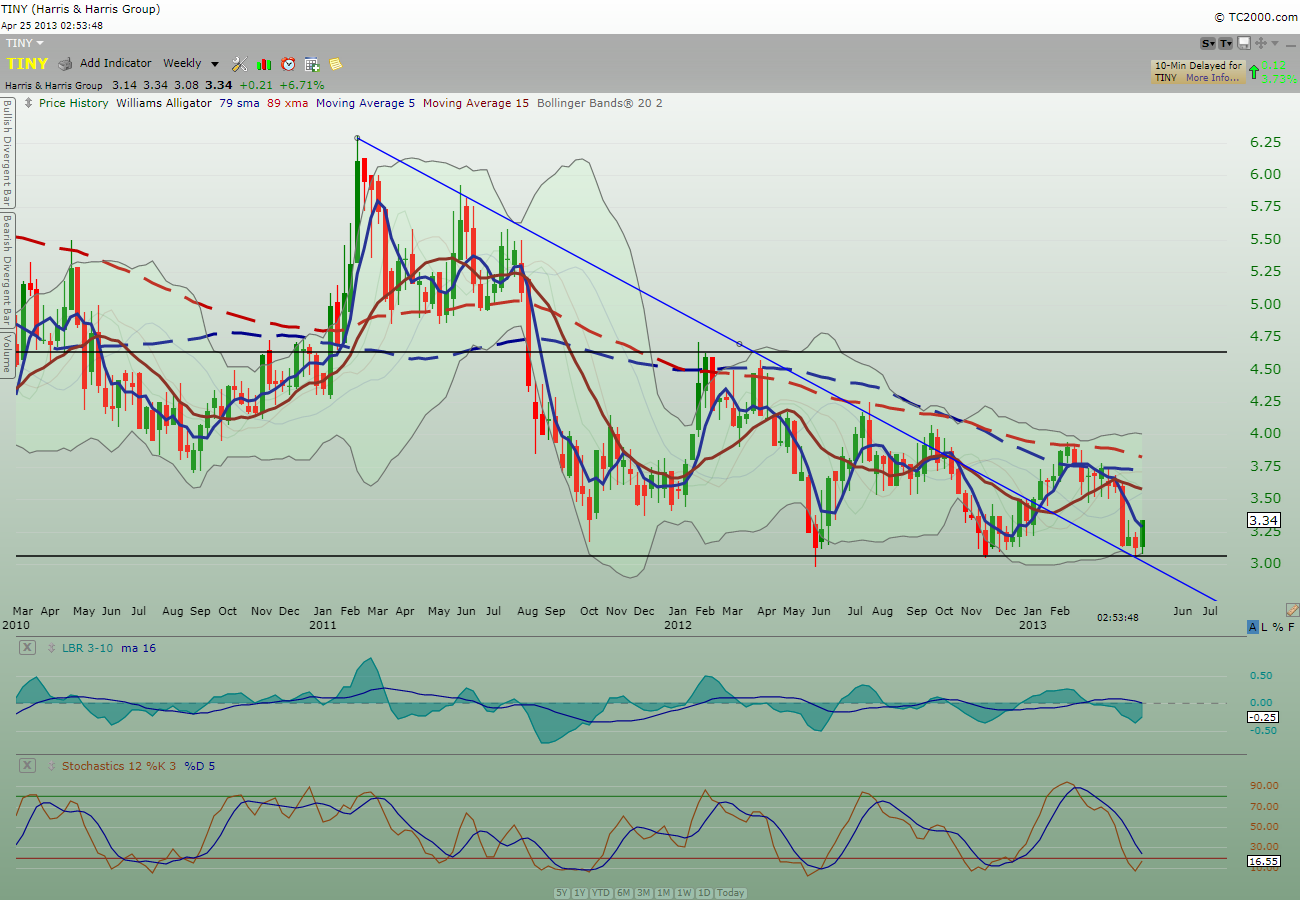
AMRN  LRAD, SZYM, TINY, RBCN, GLUU, BCRX, CHK, WPRT, DNN, PPC and 25% cash.

@tradingmy2cents

The trades I made in the journal were time-stamped in twitter

Comments »

Getting ready to Runnnn….

I joined RaginCajun this morning in $BCRX when I saw price action was acting “fizzy” after open.  Not to ignore my intuition, I bought back $BCRX and continued to add as price continued to climb.

Take a look at the $BCRX daily chart below.  You can see it broke out of the symmetrical triangle today.  Price action never breaks below the 89xma and both momentum indicators are also turning up.

BCRX_daily

Take a look at the weekly chart.  Did you see the cup & handle pattern?  A breakout of the cup & handle on the weekly chart kick off a good rally here.

BRCX_weekly

My 2 cents.

Comments »

Joined The Fly on $RBCN

I joined The Fly and bought $RBCN because the chart looks good for a breakout run.

Take a look at the $RBCN daily chart below.  Did you see the resistance around $6.78 that goes all the way back in early December 2012?  Price action today took out that resistance and is looking strong to gun for the next resistance at 04/10 high.  The two momentum indicators are pointing up and I’ve all the technical reasons to give me the confidence to jump in at this level.

RBCN_daily

Take a look at the weekly chart below.  I like the strong green weekly bar being developed this week.

RBCN_weekly

Fundamental speaking, I like the fact that $RBCN manufactures components for the LED lighting industry.

Below is the business profile from Yahoo Finance:

Business Summary

Rubicon Technology, Inc., an electronic materials provider, develops, manufactures, and sells monocrystalline sapphire and other crystalline products for light-emitting diodes (LEDs), radio frequency integrated circuits (RFICs), blue laser diodes, optoelectronics, and other optical applications. The company fabricates sapphire substrates and optical windows from the boules and sells them in core, as-cut, as-ground, and polished categories in two, three, four, six, and eight-inch diameter wafers in C, R, A, and M planar orientations. Its products include six-inch polished sapphire wafers for use in LED applications and in silicon-on-sapphire RFICs; two through four-inch diameter sapphire cores for making wafers for use in LEDs and blue laser diodes; and sapphire products that are used for windows and lenses in military, aerospace, sensor, and other applications. The company also sells optically-polished windows and ground window blanks of sapphire and various fluoride compounds, such as calcium, barium, and magnesium fluoride. Rubicon Technology sells its products directly to customers in Asia, North America, and Europe. The company was incorporated in 2001 and is headquartered in Bensenville, Illinois.

——

My 2 cents.

Comments »

Bust out or breakout?

I’ve been stalking, trading, positioning $SZYM with more headaches than any other stocks I’ve traded.  Now, I think I’m at a comfortable position with the size I want giving current price action.

Take a look at the daily $SZYM chart below.  Price took out the high of 04/11 and is about to take out the 89xma as well. 5ma crossed over 15ma and the two momentum indicators are pointing up.  On top of all the technical supports for a bullish bouncing stance, my gut/intuition tells me this one is about to take off.  (caveat: my gut/intuition does not possess the property of a divine crystal ball, so take it as a grain of salt please.)

SZYM_daily

Now, will I be proven wrong again?  From my track record with $SZYM, I’ve been proven wrong time and time again.  Like a roulette game, after so many red, black should turn up any time now, right?

My 2 cents.

Comments »

Today Portfolio Adjustment (04-23-2013)

Today was an $AAPL day.

I was not able to sit down and watch the market today so I really didn’t do much except to add $SZYM so that my position is now back to original size.

I was stopped out on my $AMRN swing trade which I later jumped back on for the bounce.  By end of day, my re-entry on the swing trade is at breakeven point.  I will see how price action behave tomorrow before deciding to scrap or keep it.

I was also stopped out of my $FB during the day.

$GLUU finally made its move today and I felt good since it was my pick for an aggressive bounce play yesterday.  I like to see $GLUU takes out the high of 03/18/2013 and go from there.  That will be my next target.

As I’m typing this post, $AAPL halt is lifted and price action was trading $18 higher.  Sweet!  I believe we may have found the bottom of $AAPL which will be last Friday low.  Now, let’s see if I can sit on my $AAPL share for a longer term hold.

Current holdings:

AMRN, LRAD, SZYM, TINY, AAPL, GLUU and 42% cash.

My 2 cents.

@tradingmy2cents

The trades I made in the journal were time-stamped in twitter


Comments »

Is this Spinning Top going to fall?

Today $SPY rally continues on and price action is now above the 2007 high once again.  On top of that, price action is now back over the up trendline that has started from 02/26 low.  However, I like to see price action takes out the previous high of 04/11 to be considered a full-on bull trend.

Take a look at the $SPY daily chart below:

SPY_Daily

Now take a look at the monthly $SPY chart again below:

SPY_monthly

Did you see the forming of a spinning top candlestick for the month of April?

Let’s take a closer look.

SPY_monthly2

A spinning top at or near critical historical resistance such as 2007 high can be a significant tell-tale sign.  I will be more cautious going forward from here in light of May being the month of patterned down month.

Below is the primer for Spinning top candlestick pattern:

Definition of ‘Spinning Top’

A type of candlestick formation where the real body is small despite a wide range of price movement throughout the trading day. This candle is often regarded as neutral and used to signal indecision about the future direction of the underlying asset.

Investopedia explains ‘Spinning Top’

If a spinning top formation is found after a prolonged uptrend, it suggests that the bulls are losing interest in the stock and that a reversal may be in the cards. On the other hand, if this formation is found in an defined downtrend, it suggests that the sellers are losing conviction and that a bottom may be forming.

Cautiously optimistic is the way to perceive current rally.

My 2 cents.

Comments »

Today Portfolio Adjustment (04-22-2013)

Today was peek-a-boo bull.

Market opened up and proceeded to head lower from there.  For about an hour after open, $SPY continued to head lower and to avoid being trapped into a waterfall down day, I started to liquidate most of my swing trade position.

First thing I did was to sell my $BCRX for small losses.  Price action was defensive from the get go and it was time to let it go.

$PACB, $CERS and $APRI were also not holding well and I dumped them quickly for small losses.

$SZYM was also under pressure.  I started to unload this one by chunk and before I knew it, I sold the whole thing in the morning.  My past experience with $SZYM was that this stock would drop like a rock rather quickly if I overstayed.  However, later in the day, $SZYM began to climb back up.  When I came back to look at the chart, I immediately bought back some shares.  And when prices continued to head higher, I bought back some more to bring it back to 70% of my original position.  Yes, I paid a premium to buy them back.

My current observation in $SZYM is that it is no longer following the old path it has taken.  Down day is now bouncing back up quickly before day is over.  I believe there are more buyers watching this stock now.  I need to evaluate if I should change my strategy on $SZYM to cut down the “quick sales” and give it more room to breathe.  My action today cost me some profit opportunity due to not holding my original position intact; but then this is hindsight talking.  Nevertheless, new information has been provided so I will take that into consideration.

I elected to move $FB stop to breakeven instead of jumping the gun to take profit and I’m glad I did.  As of now, I’m still in and has not been stopped out yet.

Unlike $FB,  I decided to take my tiny losses when $AAPL climbed back up  near my entry point this morning when I saw the over-bought signals on the momentum indicators.  Later on, I went back with a close stop and got stopped out in no time.  About five hours after open, $AAPL prices began to find support on the 89xma.  I decided to buy back in and wait.  I was not stopped out by day close even though price action gave back some territory in the last 15 minutes.  It’s all come down to earning announcement after tomorrow market close to confirm if we are seeing a bottom on $AAPL.

I saw the chart on $GLUU and I felt a calm sense that this one might be ready to bounce.  Just because I senses something doesn’t mean anything or that the price has to go up.   All it means is that there is not a lot of hesitation in me to buy this stock.  I just bought it after glancing it for a few minutes.  Currently, I’m under water for small paper losses.  I’ll see what price action will do tomorrow before deciding my future action on this one.

Current holdings:

AMRN, LRAD, TINY, AAPL, SZYM, FB, GLUU and 40% cash.

My 2 cents.

@tradingmy2cents

The trades I made in the journal were time-stamped in twitter

Comments »