iBankCoin
Home / Trading Ideas (page 7)

Trading Ideas

Zen hunts $DNN to get radioactive high

With $CCJ recovering, it is time for $DNN to play catch up.  We are getting close to the point when the uranium supply from the Russia will come to a slow drip due to expiration of the on going US-Russia HEU (highly-enriched uranium) agreement in 2013.

The chart below looks like it is ready for a bounce.

DNN_daily

I bought a starter position in the morning and later added more to double-down on the bet.

My 2 cents.

Comments »

Zen hunts $CERS for clean blood

$CERS is one my “chase” stock from Monday and I’m still riding the rally on this one.  Price action is now near the previous high of  $5.43.  A breakout of this resistance from here without any consolidation will form a left-hand cup & handle breakout pattern.  Yes, you’ve heard it right.  I don’t know if there is such a thing as left-hand cup & handle pattern in the stock chart book; if not, then I’ve just invented one.

Take a look at the chart below:

CERS_daily

Momentum is still strong with momentum indicators still point up and not yet at the over-bought level yet.

Fundamental speaking, $CERS is already selling their blood “cleaning” system outside U.S.  It is currently working with US FDA to gain approval for sales here.  As the sales start to grow outside US with the possibility of gaining US market in a year or two, the potential for $CERS will show in the price action sooner if not later.

Depending on price action in the near future, I’m still debating if I want to keep this one as a position trade.

My 2 cents.

Comments »

Zen hunts $DUST for gold scrap

I like $DUST for its power surge yesterday and I think the run isn’t over yet.  I missed the chase yesterday and today retracement in the 3m chart gave me an opportunity for a bounce play with small risk.

DUST_3m

I bought a starter position @ $103.xx and placed a stop below the recent pivot low.  See line on chart.

My 2 cents.


Comments »

Terminal Velocity –> DOWN

$AAPL has taken out the Fib 50% retracement @ $425.00 instead of bouncing off here.  A failure of a Fib support is as significant as a bounce off it.  It may be too early to say that the 50% retracement fails at $425.00 when there are still time for $AAPL to bounce back up above that line.  However, any further drowndraft away from the $425.00 line will signify a Fib 50% support failure.

AAPL_daily

I’ve initiated a small starter position (using stock and put option) based on this thesis and will see how it fairs by the end of day.  If price comes back up above $425.00, I will cover and take my small losses.

My 2 cents.

Comments »

ZEN hunts $NVAX for medicine

$NVAX chart also shows a bounce after touching the uptrend line.

Take a look at the daily chart below:

NVAX_daily

Both momentum indicators are now point up along with the 5 ma line.

A bounce is possible at this point; hence,  I bought a starter position.  This is also my prefer play in light of the bird flu situation.

My 2 cents.


Comments »

Zen hunts $FB for lunch

$FB chart looks like it is making higher low if we can get a bounce from here.

Take a look at the daily chart below:

FB_daily

The over all trend is still up and a bounce may be in the card.

I bought $FB looking for a resumption of the uptrend to take out the high @ $32.51  established in Jan 28th.

My 2 cents.

Comments »

Zen hunts $GLUU for breakfast

$GLUU looks like it is repeating price action movement of early April.  A dip below base line of $2.75 and a bounce back to the upside. Meanwhile, the 79 moving average line is trending up slowly.

Take a look at the chart below:

GLUU_daily

Both momentum indicators are also pointing up.

I bought a starter position and added more afterward.

I like to see price heads back up to the last pivot high of $3.25.   Not expecting a big move, hence breakfast only.

My 2 cents.

Comments »

Will this $AAPL cider turn into vinegar?

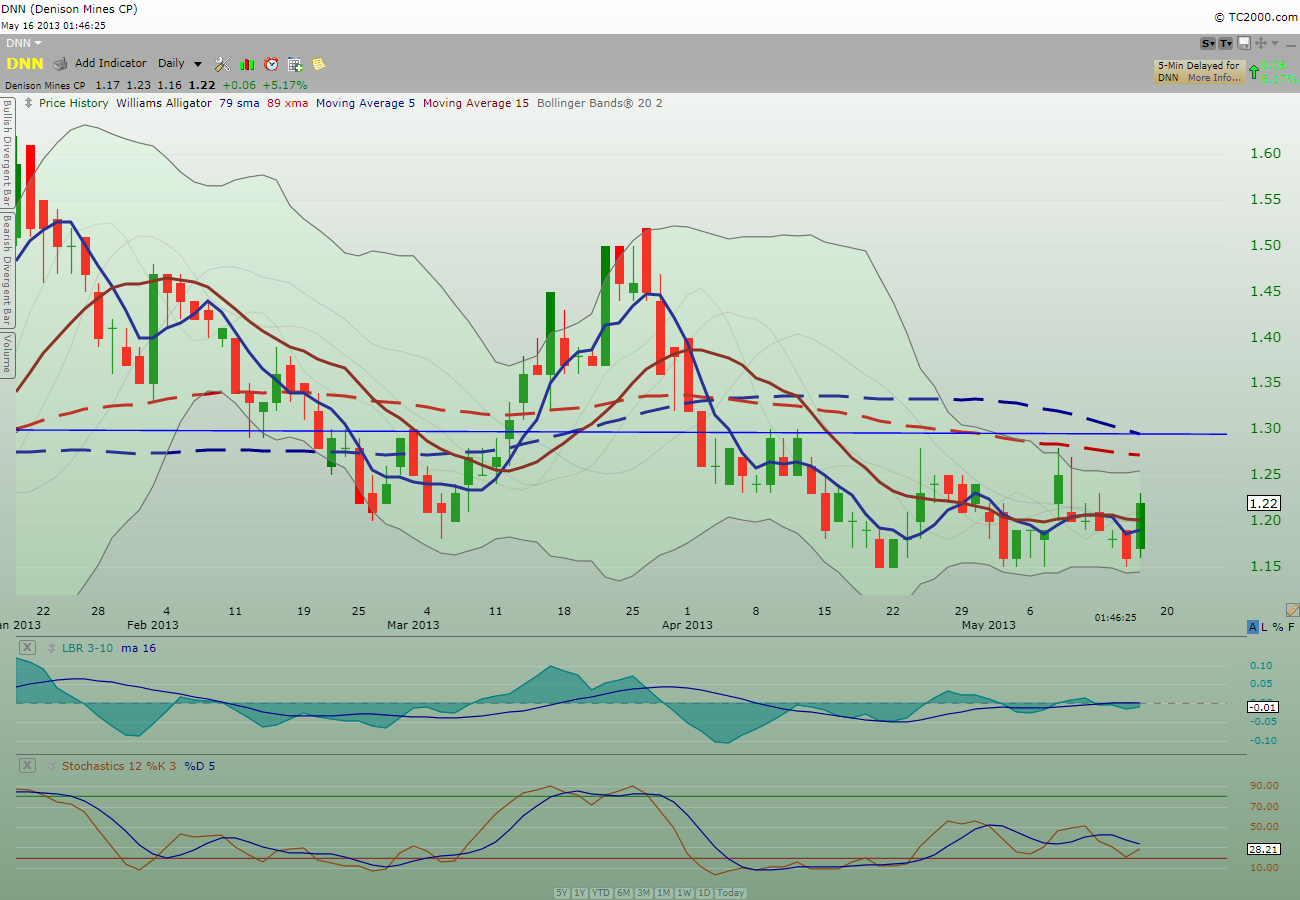
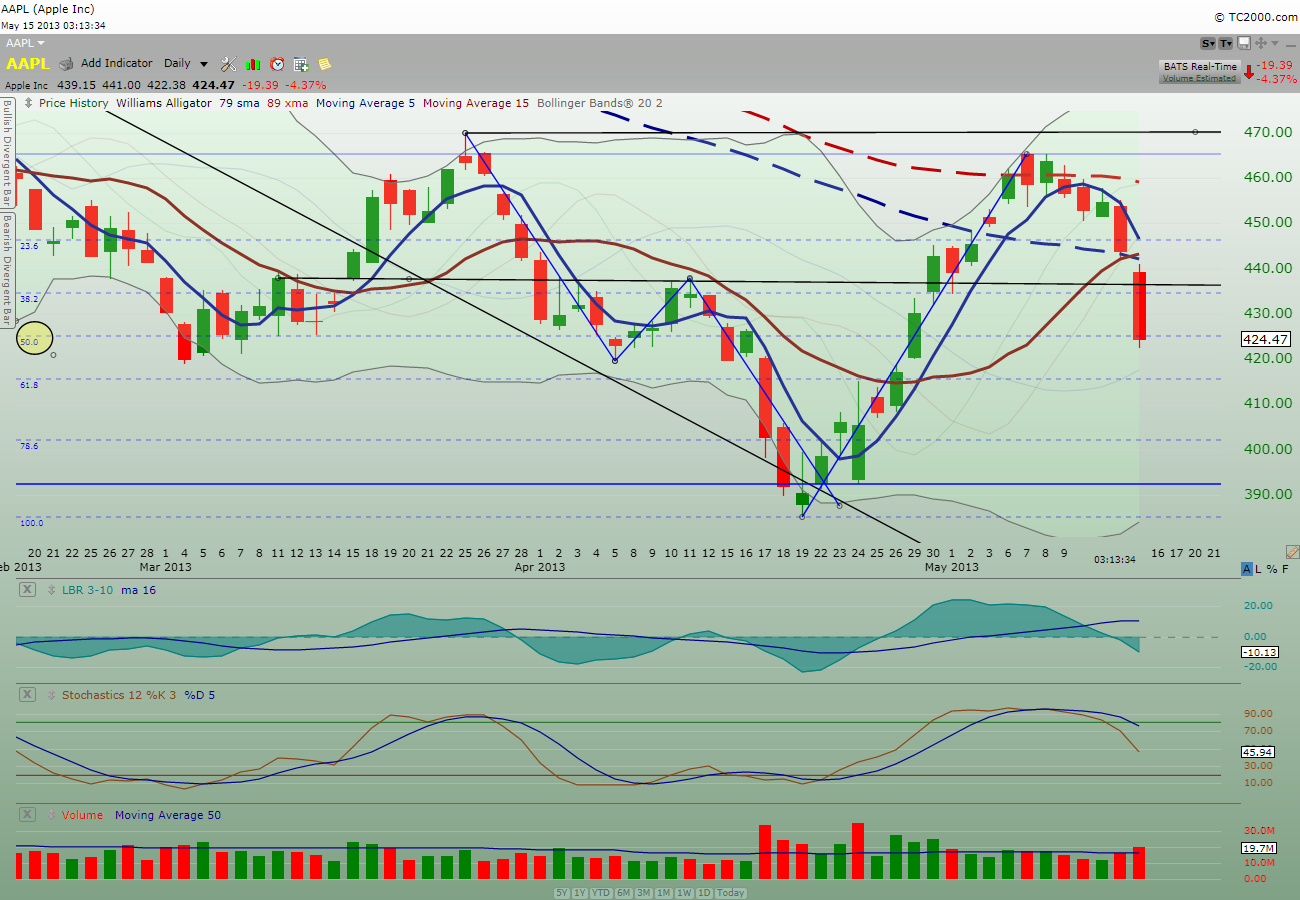
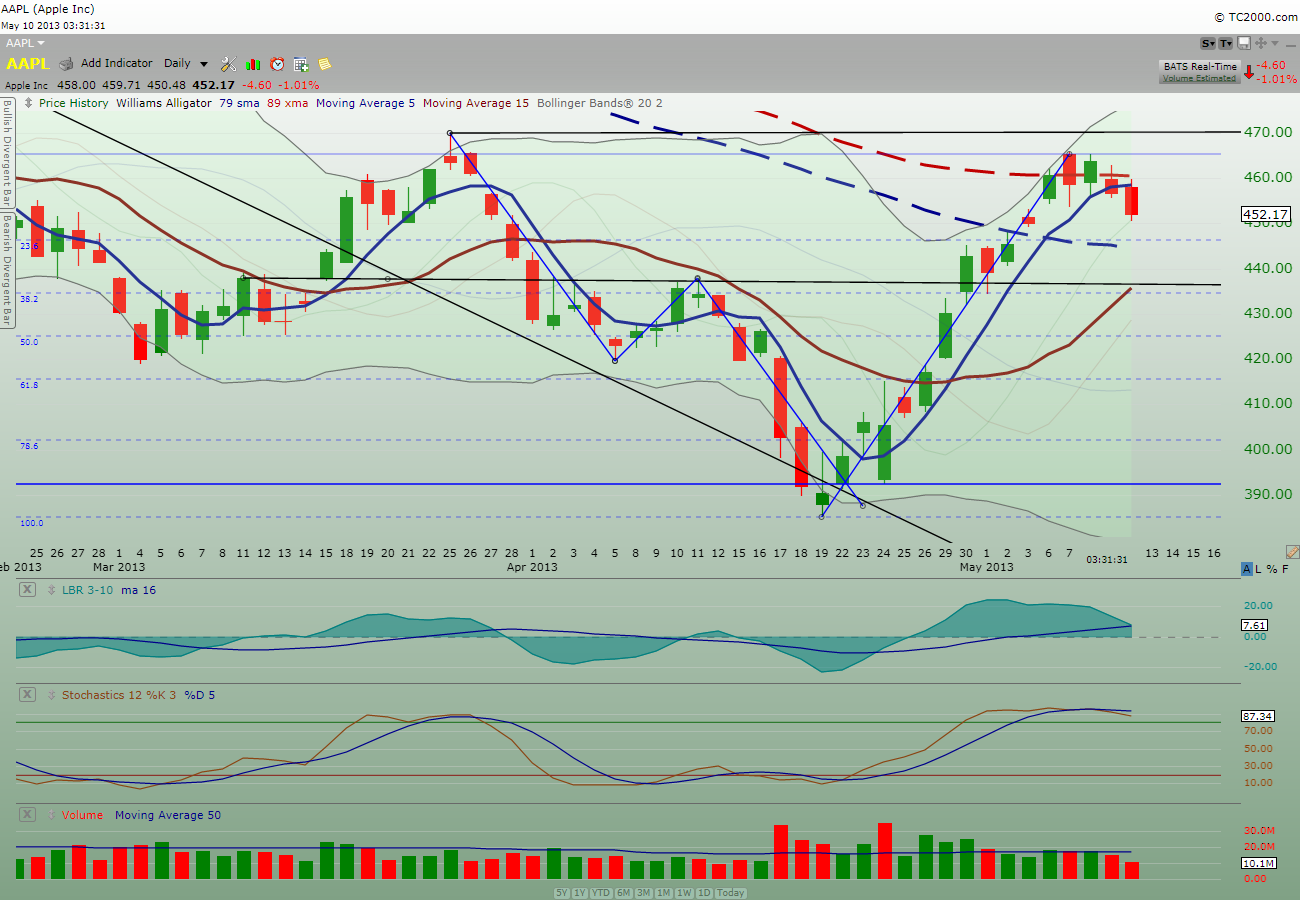
$AAPL down bar today reflects a confirmed correction to the downside simply because it has taken out the low of the bar from Tuesday, May 7th. The daily bars of Wednesday and Thursday failed to take out the Tuesday low; therefore, the trend was still up as far as I was concerned. However, today bar took out Tuesday low and price action was in the vicinity of the 89xma resistance line.

$AAPL price correction today could as well be a minor and healthy retracement. Nevertheless, I will watch for support on the 38.2% Fib retracement level at $434.75 which also happen to be near the support line from April 11th high.

Take a look at $AAPL daily chart below:
AAPL_daily

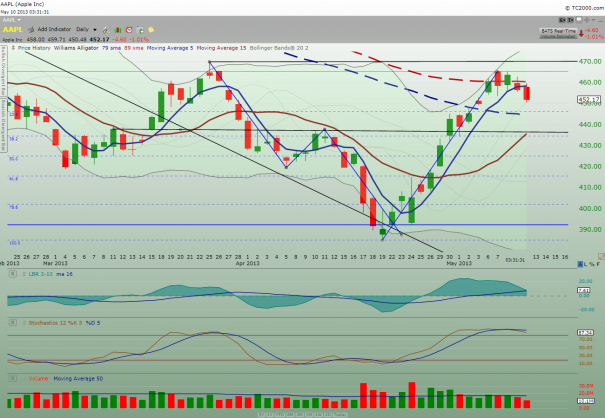
I bought June 7th 455 put option to short $AAPL. I’m betting that $AAPL correction will try to reach $435 support area before bouncing.

If there is going to be a mini-market correction, it may start next Monday and $AAPL will follow the market with it; otherwise, I will sell my put option pronto Monday morning to cut losses if the rally continues on.

My 2 cents.

Comments »

Cup and handle breakout for $SZYM

$SZYM reflects a beautiful cup and handle breakout pattern today with relative high volume.

Take a look at the daily chart.

SZYM_daily

It is important that price action stays above the $9.50 support line and not fall back underneath it going forward.  Giving the catalyst of increased capacity will be “on schedule” in the near future according the the earnings CC call, the possibility of price action heading higher is good.

I finally bought back some position this morning to take advantage of the early downdraft.  Although I’m not holding as much as I used to (I wish I did); but that is ok since I’ve to manage the risk I’m in on this one.  Risk management comes with the price of missing some money on the table IF price action reacts in your favor; on the other hands, reducing my position will also reduce the damage if price action reacts negatively.  So, I’ll have to look at $SZYM price action on a going forward basis.  In other words, I will add only if price action continue to go higher.  The number of shares I used to own is no longer relevant to my current risk profile and I will have to trade accordingly based on price action.

My 2 cents

Comments »

Coming back to the old guard

Remember $CTSH?

$CTSH had a monster run from a low $14 to $83 from late 2008 to early 2011 before it started having hiccup over the next two years.  I believe the current hiccup has come to a conclusion and price may just be heading back up soon.

Take a look at the weekly chart below:

CTSH_weekly2

Take a close look at the weekly chart again:

CTSH_weekly

As you can see, this week may confirm the Bullish Harami weekly candlestick pattern for a bullish reversal.  Momentum indicators are also coming back up from the low point.

Take a look at the daily chart below:

CTSH_daily

Price took off after positive earnings report and the momentum may continue with the 5 ma line crossed over the 15 ma line today.

My 2 cents.

Comments »