iBankCoin
Home / Trading Ideas (page 13)

Trading Ideas

Where’s the bear?

Wait a minute, wasn’t there supposed to be bear around here?  Where did it go?

If the Bull can continue to piss on the bear then the bear may finally get the message- the BULL will take the GW2 by end of this week!

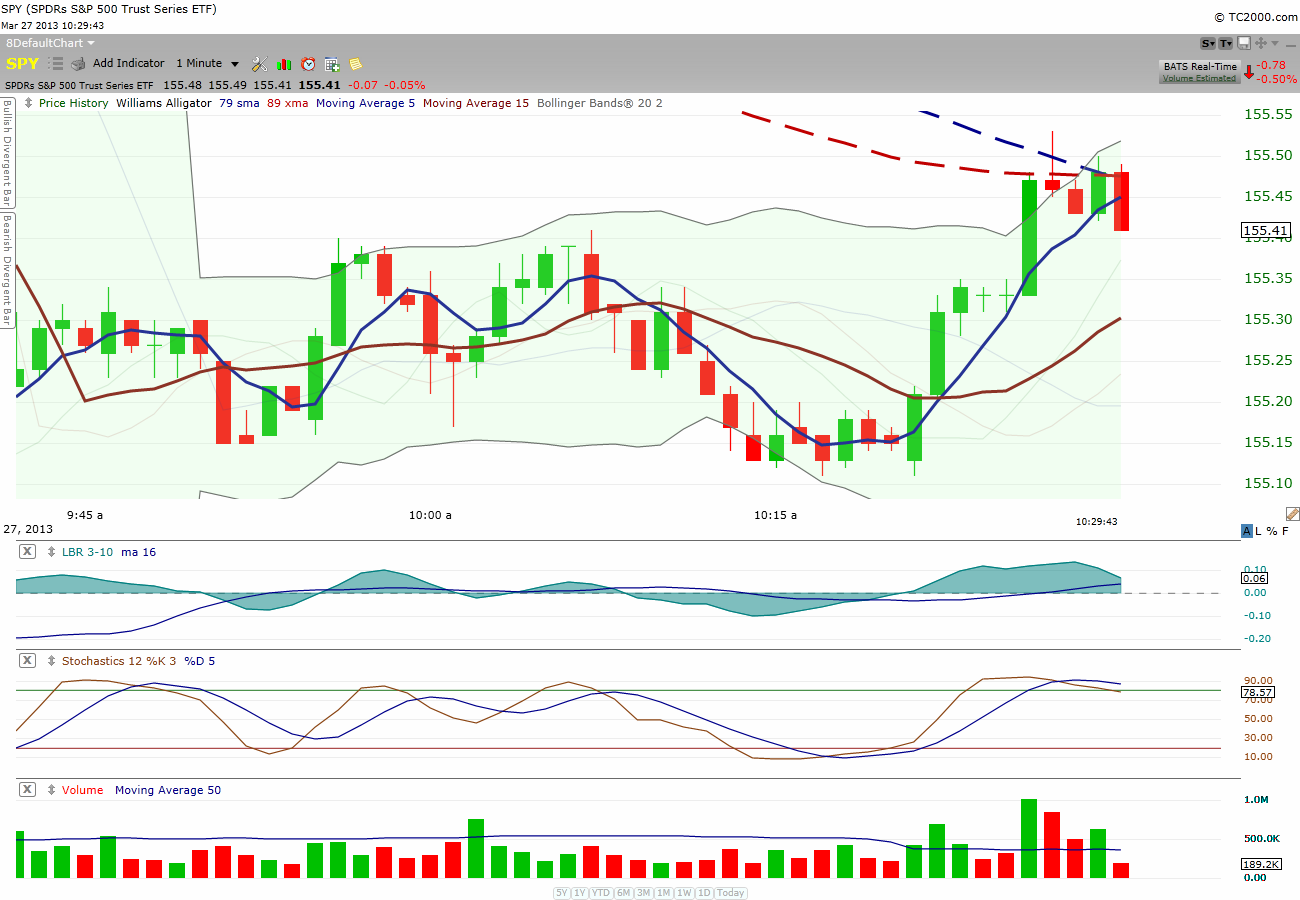
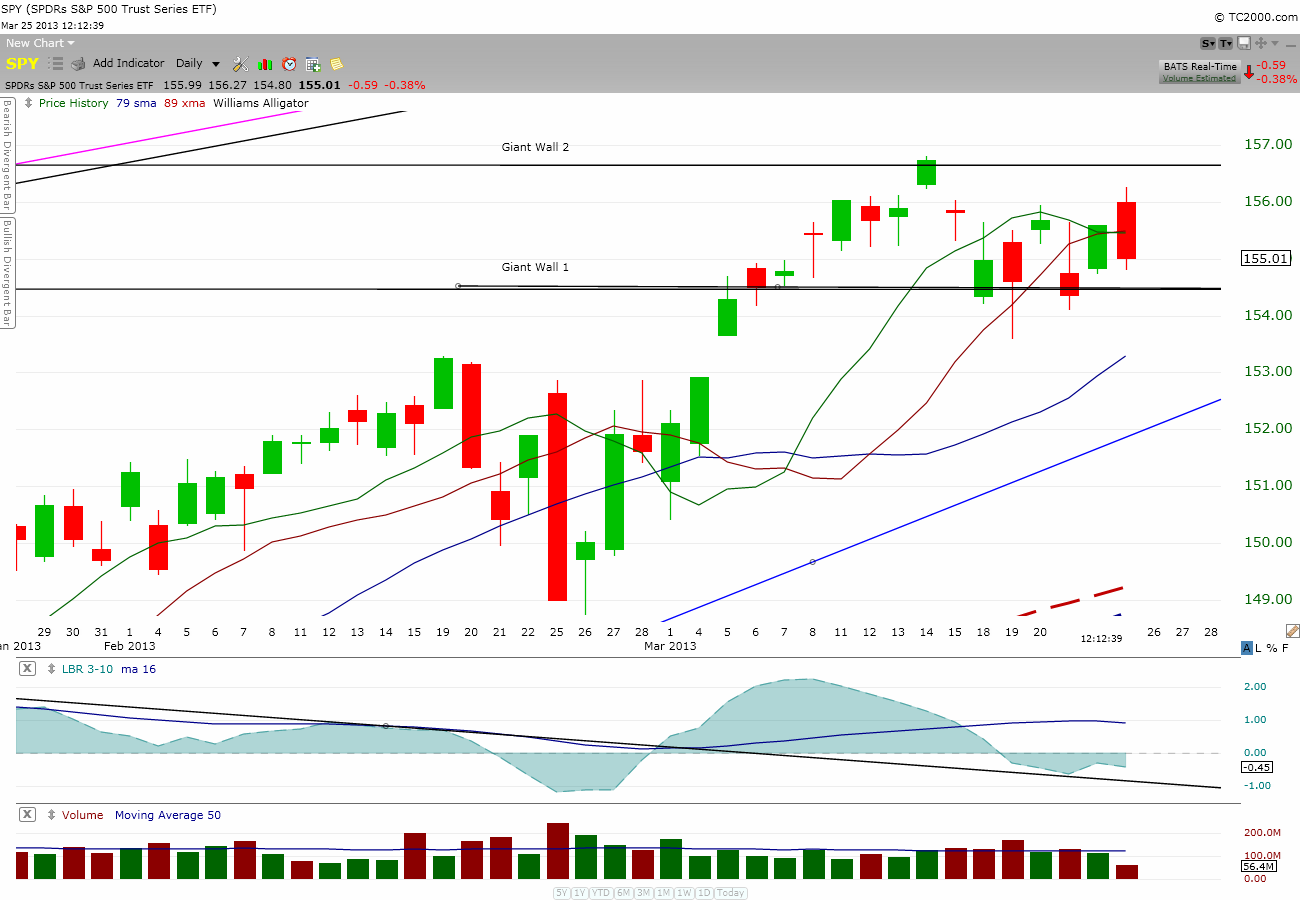
Take a look at the $SPY daily chart below:

SPY_Daily

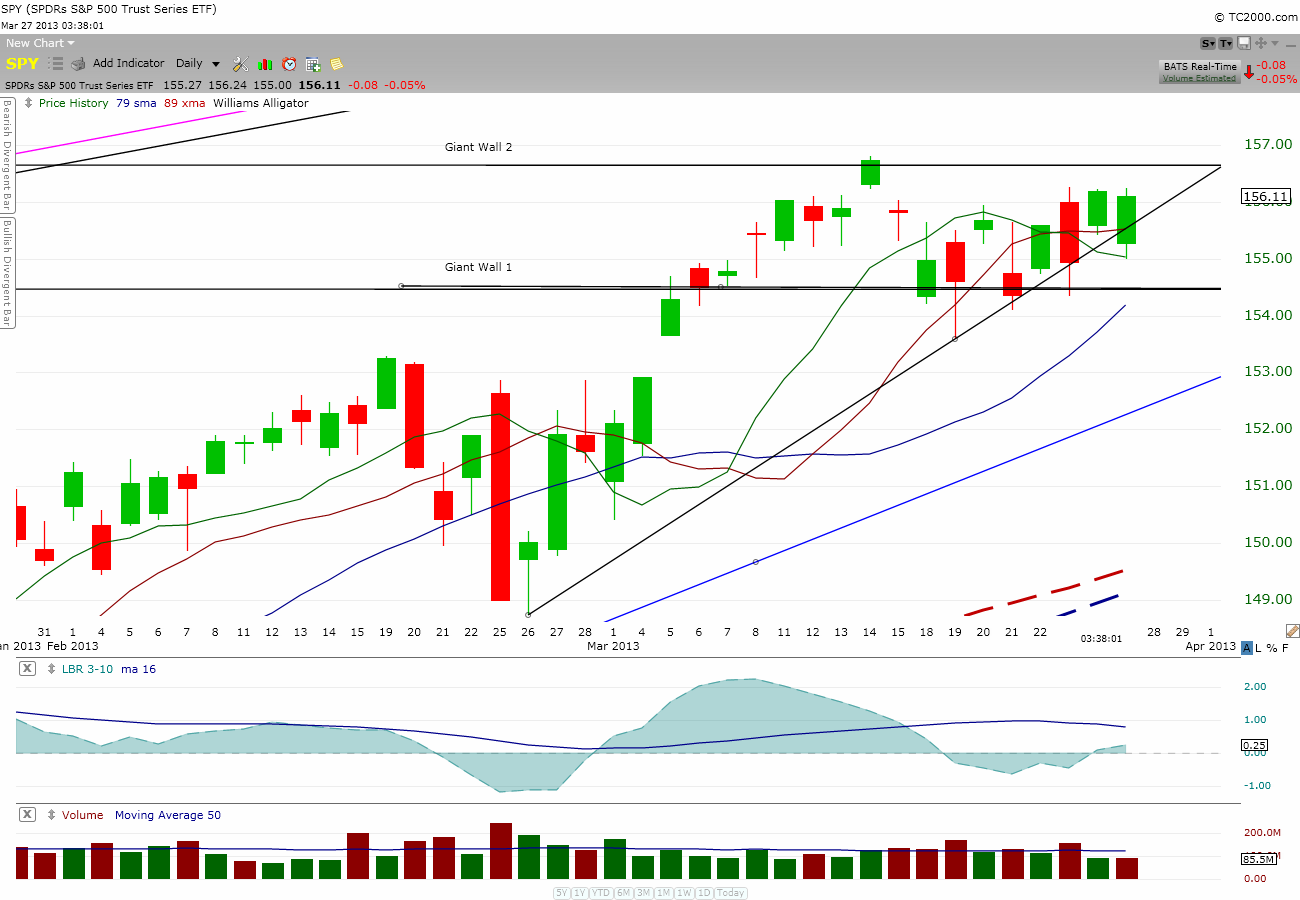
Does it look like the bear is in control?  No?  I see more green bars than red.  Not only that, I see the uptrend is still inside the uptrend line.  On closer look, we are ALMOST there at GW2!

Get ready to celebrate an historical event of our mankind driving the stock market into an historical high again.

Yipee YapaDoo!

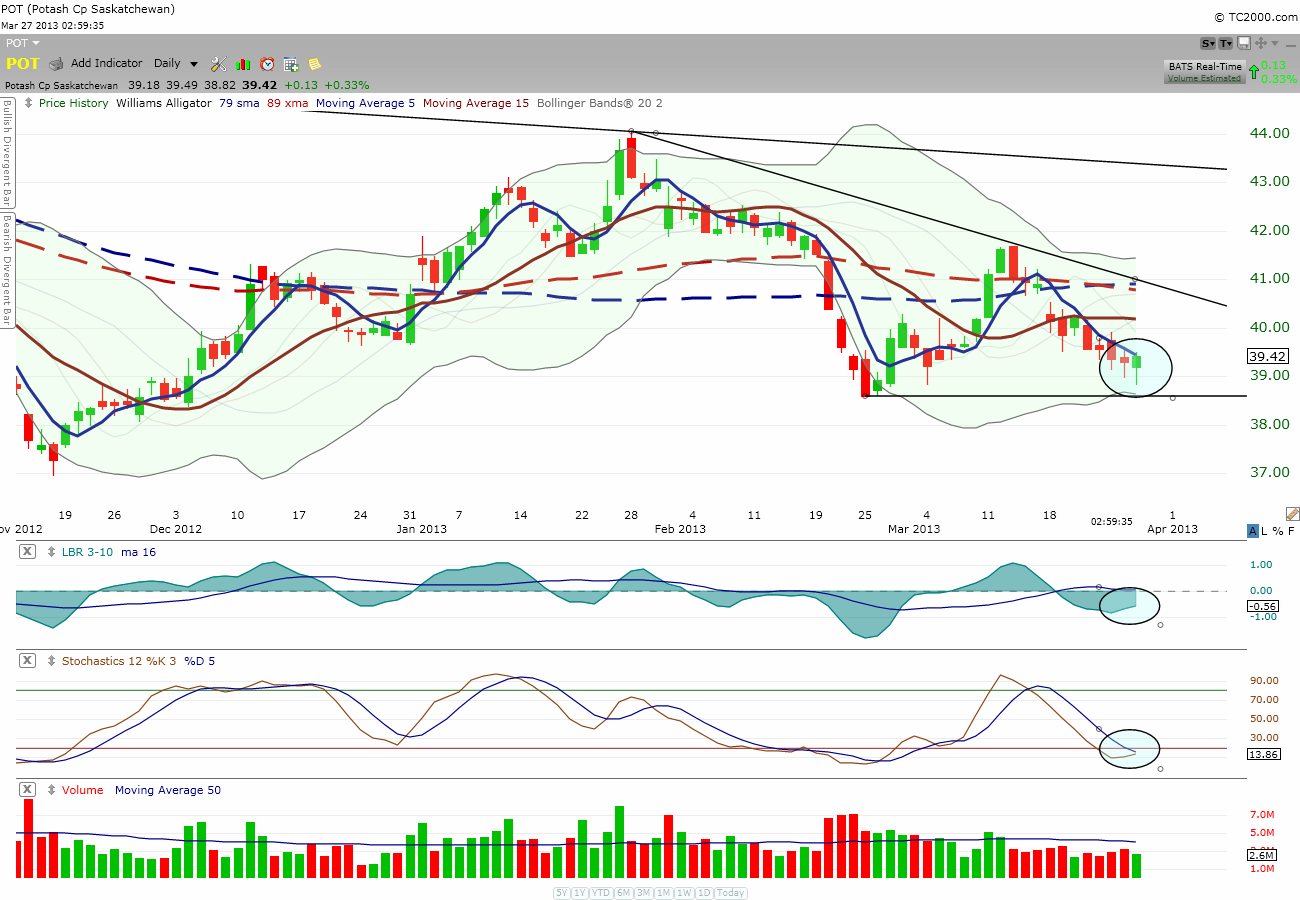
Oh, don’t mind me, I’ve been smoking too much $POT…

My 2 cents.

Comments »

Anyone wants some pot?

No, not the smoking kind; the stock $POT I’m talking about.  This is another Sooz’s alert that I’m now convinced the bottom may be found.

Today nice green candlestick bar with a tail is a nice touch.  It’s not exactly a hammer candlestick pattern since there is a hair sticking out of its head but because it is near a support area; who care?

I’m buying anyway.

Take a look at the daily chart below:

POT_daily

Did you see the momentum indicators (two of them, Wow!) turning up?  This is good enough for me.  You see, I’m an easy fellow to please when it comes to bottom fishing…

I’ll put my stop below the support line.

My 2 cents.

Comments »

$FB is screaming at my face- BUY!

I tried to buy back $FB after I dumped it this morning because of the gap-down open; but the retracement never came.  So, I did what anyone who wanted in do; buy at the market just to get in for the starter position.

Take a look at the 15m $FB chart below:

FB_15m

I had a buy order at $25.50 and it was completely ignored ’cause price just kept going up.   The rally is very strong and this could be a catalyst for the bounce back up to the $30.xx range.

Take a look at the massive bullish engulfment bar in the daily chart right now:

FB_daily

It cut through the 5 moving average and broke thru the high of the last four days.  I just added more $FB because price kept going up.

A special thanks to Sooz who alerted me of $FB last week which I added to my “to watch” list.

My 2 cents.


Comments »

When does seesaw becomes a whipsaw?

It is when you are whipped for putting chewing gum under a public park seesaw in Singapore.

Today is a day to be cautious.  I sold all my swing trades pronto at open without thinking much.  All for small losses. I even reduced position size on $SZYM with the intent to buy them back cheaper.

So far, all mini-rallies are being countered with a bear attack; therefore if you are thinking about bargain hunting, you may want to put a tight stop “just in case”.

Below is the 1m $SPY chart:

SPY_1m

Be safe!

My 2 cents.


Comments »

Let’s face it, $FB may be seeing a bottom

Look at the daily $FB chart below.

Today is an up day after landing on the support zone.  When I see price action acting positive on a support zone after a downtrend, I consider it a low risk trade in trading a bottom.  I buy with a stop below the day low which often gives me a low risk trade.

FB_daily


Needless to day, I bought a starter position on $FB with a stop below intra-day low.

My 2 cents.

Comments »

This stubborn bear is beginning to annoy…

Take a look at the 15m $SPY chart below:

SPY_15m

The market opened and rose up nicely and then had a waterfall price drop to show for the day.  If you are not annoyed then I take my hat off for you.  But my internal radar alerted me to move to cash; therefore, I spent all morning liquidating all my swing trades position and raised my cash to 50% as well.  (I said ‘as well’ because I just read The Fly posted that he was also at 50% cash.)  Thus, in a manner of speaking, I fired all my swing trade positions today.  However, due to an incessant pleading from $DCTH, I hired it back for a temporary basis to see if it can prove itself to make me some dough.

Take a look at the daily chart below, if the bear has its way, price action may just as well drop below the GW1 support.  Sometimes, it is better to be safe than sorry.

SPY_Daily

Be safe!

My 2 cents.


Comments »

TIMBER! Watch out for the Blackberry trees!

With $AAPL restoring back to its darling status, who needs $BBRY?

I saw weakness in the $BBRY all morning and failed one short attempt; but when $BBRY breached the $16 level, that had to be the tell.  So I shorted $BBRY again.

Look at the 3m $BBRY chart below.  Did you see the waterfall price action?  I love waterfall price action when I’m trying to short; and I loathe waterfall price action when I’m long.

Take a look at that beautiful waterfall from the courtesy of $BBRY:

BBRY_3m

I guess rumor of $AAPL launching new iPhones in the summer isn’t helping the Blackberry trees…

My 2 cents.

Comments »

Consolidating in the twilight zone… Oop! I meant twi-walls zone

Today $SPY bounce confirmed the solidity of Giant Wall One as a support.  Thus, price action is now consolidating inside the two Giant Walls.

I see this as a confirmation that the bear is not winning the war here; otherwise, $SPY would have fallen under GW1 and created widespread panic.  Last night before I went to bed, SP500 was printing negative 2.50 but I told myself that I would wake up to see a positive SP500; lo and behold, I was right.  Why would I think that?  That is because I see the GW1 as a huge support.  You see, these two mythical walls from 2007 and 2000 hold a lot of psychological power among us simply because of its historical significance.  Thus, each of these two walls can either be a powerful resistance or support.  It just so happen that these two walls are in the vicinity of each other that we have a twi-wall zone that holds such unfathomable power.

Consider ourselves lucky to be witnessing such historical price interaction inside these two mythical walls.  Due to the steeper angle of this current rally, my money is that we are taking out GW2 shortly.

Take a look at the daily chart below and you will understand where I’m coming from:

SPY_Daily

My 2 cents.

Comments »

The Insatiable $AAPL wants more!

I was doing my normal stock stalking and then all of a sudden, $AAPL blew me a breeze and winked her eyes at me.  One look at the chart and I could see what $AAPL meant.  She wanted to get high with me.

“Come over here and take me with you, NOW!”

Jeez, I couldn’t say no to that, immediately, I bought some $AAPL and she was right, she really wanted to go higher.

Look at the $AAPL 5m chart below and you will know what I mean:

AAPL_5m

Take a look at the 15m chart below:

$AAPL went over the resistance established yesterday @ 09:45am.

AAPL_15m

So far, $AAPL is making me very happy! 🙂

My 2 cents.

Comments »

SNAP! But the mouse ($DDD) got away from the trap…

It was a trap alright, as predicted by The Fly, and I was stopped out early in the morning; however, being stopped out is only a rest stop for me to take a break, so I watched for a floor to form in the 3m chart and it did.  Without hesitation, I jumped right back in with stop below today intra-day low.  After some struggling with the bear, the bull finally won over later in the day.

The daily chart does look incredible promising for a possible rally to the upside.  Look how the green bar has already penetrated the downtrend line.  $DDD is one of those animals that, when spook, will run three miles in a New York minute (up or down).  I’m expecting to see $DDD make a mad dash to the upside next week if the general market is done with the correction already.

DDD_daily

Below is the weekly chart:

DDD_weekly

Look at the solid green bar being formed this week.  They even have a name in the candlestick library to identify the pattern of today green bar versus yesterday bar.  It is called the bullish piercing pattern.

I added more $DDD so I now hold more than I’ve held yesterday.

My 2 cents.


Comments »