iBankCoin
Home / 2013 (page 18)

Yearly Archives: 2013

Is this Spinning Top going to fall?

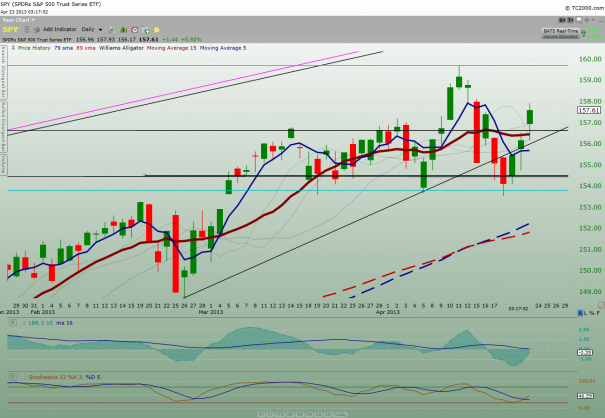
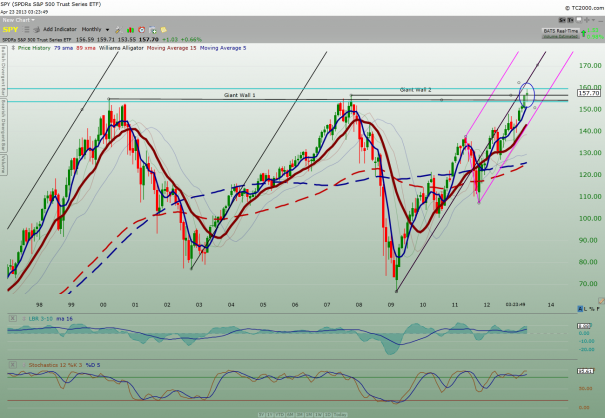
Today $SPY rally continues on and price action is now above the 2007 high once again.  On top of that, price action is now back over the up trendline that has started from 02/26 low.  However, I like to see price action takes out the previous high of 04/11 to be considered a full-on bull trend.

Take a look at the $SPY daily chart below:

SPY_Daily

Now take a look at the monthly $SPY chart again below:

SPY_monthly

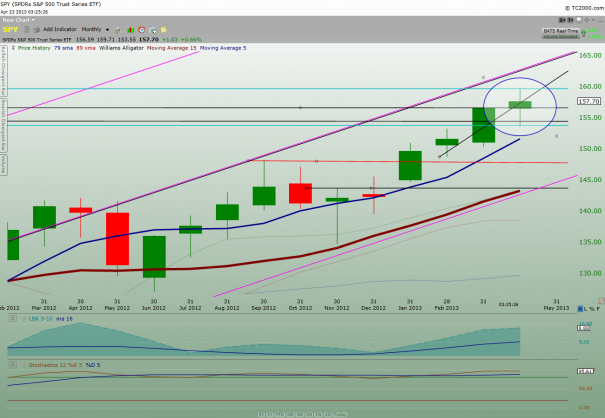
Did you see the forming of a spinning top candlestick for the month of April?

Let’s take a closer look.

SPY_monthly2

A spinning top at or near critical historical resistance such as 2007 high can be a significant tell-tale sign.  I will be more cautious going forward from here in light of May being the month of patterned down month.

Below is the primer for Spinning top candlestick pattern:

Definition of ‘Spinning Top’

A type of candlestick formation where the real body is small despite a wide range of price movement throughout the trading day. This candle is often regarded as neutral and used to signal indecision about the future direction of the underlying asset.

Investopedia explains ‘Spinning Top’

If a spinning top formation is found after a prolonged uptrend, it suggests that the bulls are losing interest in the stock and that a reversal may be in the cards. On the other hand, if this formation is found in an defined downtrend, it suggests that the sellers are losing conviction and that a bottom may be forming.

Cautiously optimistic is the way to perceive current rally.

My 2 cents.

Comments »

Today Portfolio Adjustment (04-22-2013)

Today was peek-a-boo bull.

Market opened up and proceeded to head lower from there.  For about an hour after open, $SPY continued to head lower and to avoid being trapped into a waterfall down day, I started to liquidate most of my swing trade position.

First thing I did was to sell my $BCRX for small losses.  Price action was defensive from the get go and it was time to let it go.

$PACB, $CERS and $APRI were also not holding well and I dumped them quickly for small losses.

$SZYM was also under pressure.  I started to unload this one by chunk and before I knew it, I sold the whole thing in the morning.  My past experience with $SZYM was that this stock would drop like a rock rather quickly if I overstayed.  However, later in the day, $SZYM began to climb back up.  When I came back to look at the chart, I immediately bought back some shares.  And when prices continued to head higher, I bought back some more to bring it back to 70% of my original position.  Yes, I paid a premium to buy them back.

My current observation in $SZYM is that it is no longer following the old path it has taken.  Down day is now bouncing back up quickly before day is over.  I believe there are more buyers watching this stock now.  I need to evaluate if I should change my strategy on $SZYM to cut down the “quick sales” and give it more room to breathe.  My action today cost me some profit opportunity due to not holding my original position intact; but then this is hindsight talking.  Nevertheless, new information has been provided so I will take that into consideration.

I elected to move $FB stop to breakeven instead of jumping the gun to take profit and I’m glad I did.  As of now, I’m still in and has not been stopped out yet.

Unlike $FB,  I decided to take my tiny losses when $AAPL climbed back up  near my entry point this morning when I saw the over-bought signals on the momentum indicators.  Later on, I went back with a close stop and got stopped out in no time.  About five hours after open, $AAPL prices began to find support on the 89xma.  I decided to buy back in and wait.  I was not stopped out by day close even though price action gave back some territory in the last 15 minutes.  It’s all come down to earning announcement after tomorrow market close to confirm if we are seeing a bottom on $AAPL.

I saw the chart on $GLUU and I felt a calm sense that this one might be ready to bounce.  Just because I senses something doesn’t mean anything or that the price has to go up.   All it means is that there is not a lot of hesitation in me to buy this stock.  I just bought it after glancing it for a few minutes.  Currently, I’m under water for small paper losses.  I’ll see what price action will do tomorrow before deciding my future action on this one.

Current holdings:

AMRN, LRAD, TINY, AAPL, SZYM, FB, GLUU and 40% cash.

My 2 cents.

@tradingmy2cents

The trades I made in the journal were time-stamped in twitter

Comments »

Bullish Candlestick Pattern: “Morning Star” is shining on…

$AAPL.

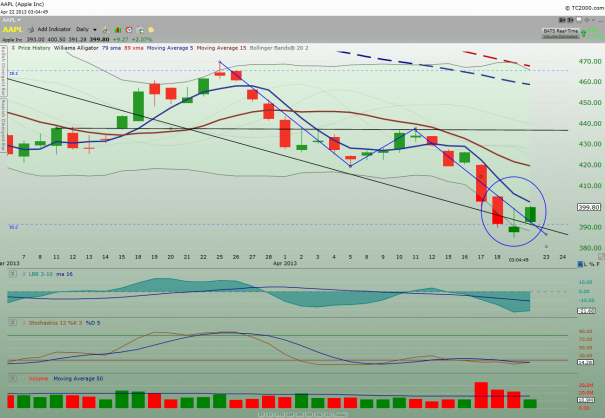
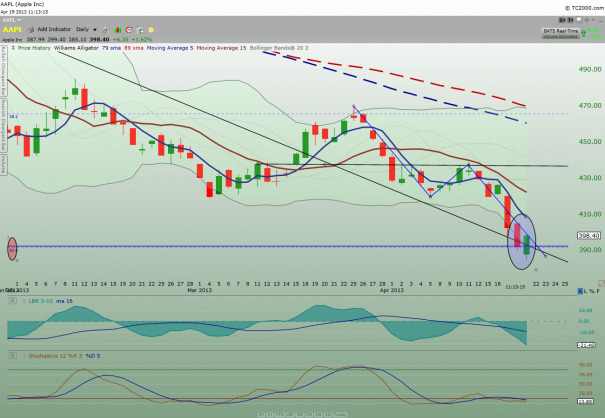
I got stopped out earlier in the morning during the downdraft but re-entered my position on $AAPL after the dust was settled; therefore I’m still long $AAPL.  If the Morning Star bullish pattern continues to hold until day close, we “may” find the bottom on $AAPL.

Take a look at the Morning Star pattern (inside the circle).

AAPL_daily

Of course, $AAPL earning report after close tomorrow will be the deciding point of $AAPL’s future direction.

Below is the primer on Morning Star Candlestick pattern:

Morning Star

The morning star consists of three candlesticks:

  1. A long black candlestick.
  2. A small white or black candlestick that gaps below the close of the previous candlestick. This candlestick can also be a doji, in which case the pattern would be a morning doji star.
  3. A long white candlestick.

The black candlestick confirms that the decline remains in force and selling dominates. When the second candlestick gaps down, it provides further evidence of selling pressure. However, the decline ceases or slows significantly after the gap and a small candlestick forms. The small candlestick indicates indecision and a possible reversal of trend. If the small candlestick is a doji, the chances of a reversal increase. The third long white candlestick provides bullish confirmation of the reversal.

Broadcom Corp. (BRCM) Candlestick Morning Doji Star example chart from StockCharts.com

After declining from above 180 to below 120, Broadcom (BRCM)[Brcm] formed a morning doji star and subsequently advanced above 160 in the next three days. These are strong reversal patterns and do not require further bullish confirmation, beyond the long white candlestick on the third day. After the advance above 160, a two-week pullback followed and the stock formed a piecing pattern (red arrow) that was confirmed with a large gap up.

My 2 cents.

Comments »

Bounce Alert for Aggressive Play

I like $GLUU here.

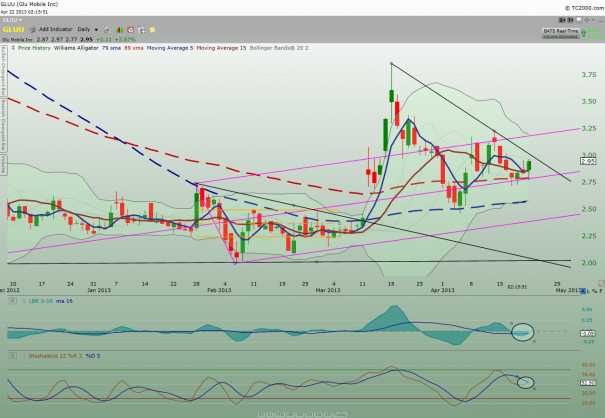
As you can see from the daily $GLUU chart below, it is bouncing off the  Andrew Forks mid-line  with two momentum indicators turning up.  While the downtrend line still needs to be broken to the upside to be even considered a possible trend change.  I’m playing this one more aggressively because I’m sensing a bounce here.

GLUU_daily

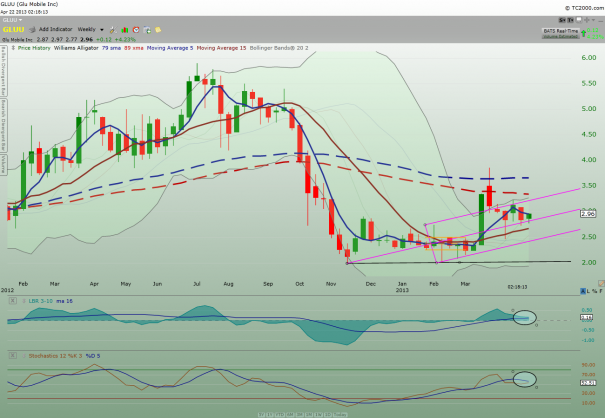
Below is the $GLUU weekly chart.

GLUU_Weekly

Last time I got into $GLUU, I bailed out too soon and missed the gap up later.  Will I catch the ride this time?

My 2 cents.

Comments »

Where Ego Dares #2: Thought

Last time, in Osho’s essay, he postulated that The Mind is nothing more than a continuous thought process.

Key components: continuous + thought + process

Let’s start with thought.

What is thought, really?

The moment you utter a word in any language in your head, you have thought.

Why do we have thought?

I believe the three items below encompass the majority of the reasons

  1. we want something
  2. we describe something
  3. intuition

1) We want something

You are walking in the woods and you feel an urge to pee.  “I’ve got to find a place to pee.” becomes your thought.

2) We describe something

While looking for a place to pee, you’re thinking, “there are some tall bushes over there I can hide while I pee”.

3) Intuition

“Wait a minute, something doesn’t feel right over there,” becomes your thought as you approach the area.

I’m sure you can come with some other reason why we have thought; but most likely they can fall into one of the three categories above.

What if I’m solving a problem?

This is an interesting question!  You know why?  Because the thought involves in solving a problem can morph from one of the three to another.

First, you describe the problem, then you want the problem solves.  Later, your answer to the problem comes from your intuition.

While the three examples above are in extreme simple form, these three drivers of our thought are able to weave a continuous complex thought process in our head that gives birth to our mind.

Now, we have body and mind.

What is the deal with body and mind?

Well, our mind, being a complex thought process we weave together in the language of our creation, happens to be “floating like a cloud” as a result of the neuron firing process in our brain which is the command center of our body.

So, when the mind says jump, our body jumps.  When the mind says cry because it is thinking of a painful situation, tears come out of our eyes.

“Impossible! This sure-winner stock dropped like a rock right after I bought!”  When you think this, your body goes through the emotional state of disbelief and even anger and yet you decide to buy more to average down.

Here is another way to express your thought in the same situation, “Jeez stock dropped like a rock after I bought, I’m getting out right now!” Your body goes through the emotion of relief for getting out of the stock pronto.

You can obviously see the big difference between the two thoughts above.

How do one ends up picking either one of the above thoughts then?

Excellent question!

This is where your ego comes into the picture.

Before moving on with the discussion of ego, remember this from Osho?

If somebody is controlling the mind, then it will only be only a part, a fragment of the mind controlling another fragment of the mind. That is what the ego is.

So you have a thought process that creates a mind that says “this stock has to go up because my analysis of the fundamental is corrected” even though the stock price has been declining for the last month. This mind creates stubbornness in you..

Meanwhile, you have another set of thought process that creates a separate mind that says, “OMG! How can it be? My money is losing fast and I may be getting a margin call soon if I don’t do something!” This mind creates fear in you.

Now, you have “a fragment of the mind controlling another fragment of the mind”

– I am right against fear of loss

or

– stubbornness against fear.

When these two minds in us collide with equal force, you have created a “deer in the headlights” situation- you are effectively frozen in action.

Going back to the two earlier examples:

“Impossible! The sure-winner stock dropped like a rock right after I bought!”  When you think this, your body goes through the emotional state of disbelief and even anger and yet you decide to buy more to average down.

Which part of the mind has control in the above example?  Yes, the “I am right” mind.

Here is another way to express thought in the same situation, “Jeez stock dropped like a rock after I bought, I’m getting out right now!” Your body goes through the emotion of relief for getting out of the stock pronto.

Which part of the mind has control in the above example?  Yes, the “fear of loss” mind.

So, at the end of the day, it is all depended on which part of the mind has more juice to back it up.  In other words, the mind with more training and exposure usually win the day.

And which of the the mind do you think usually has control during the day?

You’ve got it, the “I am right” mind.

You know why?

It is how we are programmed to think by our society.  We mimic the “I am right” mind of our parents, the school teachers, and all authority figures we want to become when we grow up.

While this “I am right” mind works wonderfully in our society and in the business world, it can be a hindrance when it comes to trading.

Therefore, our task as a trader/investor is to train our thought process in the direction of “fear of loss” mindset along with the art of following price action.  In other words, we have to train this mindset so it becomes the dominant mind (aka ego) when it comes to making a final decision on the trade.

But it’s easier said than done. 

Let me show you how I make it works for me.

Overtimes, I’ve engineered my “I am right” mind to work on my position trades and keep it busy there while I train my “fear of loss” mind to cut losses during swing trading.  Yes, I disable the ability of the “I am right” mind to average down.  To do a conditional average down, my “fear of loss” mind will be the one to take that trade.

So far so good.

The beauty is that my “I am right” mind is not dominating 100% of my portfolio which will be quite dangerous if it is.

That is all for today.

Btw, I did not come up with all the above thought process on my own.  Since I’ve read many books in the past, I’m simply putting together thought processes from others in a way that works for me.

My 2 cents. 

Comments »

Today Portfolio Adjustment (04-19-2013)

Today was like a drop of sunshine on my face.

The morning open was quite intriguing.  Dow Jones was down but the SP500-emini was up.  It was very rare to have DOW and the SP500 diverted away from each other.  Upon looking at the DJ30 watchlist, $IBM, $GE, & $HPQ were the culprits.  It was almost comical to watch how the SP500 and the DJ30 dueled with each other all day trying to get a upper hand.  At the end, the SP500 won over by dragging the DJ30 back into positive area.

Well, believe it or not, I bought additional shares of $AMRN today as a swing trade with a stop below yesterday low.  Now, some of you may say, “Hey, what happen to your ‘NEVER AVERAGE DOWN’ swan song you’ve been preaching all this times?

Now, now… I’m not averaging down with no stop in sight for these new shares I’ve bought today.  I bought these shares with the expressed intention to dump it if my stop below yesterday low was hit.  In other words, while my core position shares have no stop (my loss of original investment is my worst case stop); these new shares don’t share the same flexibility.  However, if $AMRN continues to climb from here, I’ll eventually move my stop for these new shares to the breakeven point using a GTC (good till cancel) stop.  If prices continues on without hitting my breakeven stop, I’ll be riding $AMRN back up with more shares than original.

Now, isn’t it a swell plan?  I’ve this conditional average down scenario that will benefit me if $AMRN bottoms here; on the other hand, if $AMRN continues to head south even more, I’ll be back to my original shares with a swing trade losses which is no difference than a losses from another swing trade of another stock.

$PACB opened and headed higher right out of the gate, I immediately jumped in and bought back shares.  Let’s see if I can get a V-shape bounce from here starting next week.  By end of day, I’m in the money on this one.

$CERS offered the same opening pattern of $PACB and I jumped in as well.  I was well into the money until the last hour dumping put me back into a precarious position.  I immediately sold half of my position  and is now taking a small paper loss on the book.

$FB acted positively in the morning and I bought starter position.  $FB’s yesterday low was near the support established by the low of 02/28. Therefore with today positive opening, I didn’t hesitate to jump in. Later on I moved my stop to breakeven and was stopped out. And when the bounce came after I sold, I bought back in again.

$BCRX was refusing to tank so I bought back in a starter position.  However, toward the end of the day, price began to weaken so I sold half of the position I bought to minimize exposure.

$SZYM was actually quite volatile today despite being an up day.  After the gap-open.I waited for the retracement before I started adding.   Later on, $SZYM began a slow climb up and was looking strong all day until the tail end when it gave back half of the day gain back.  Seeing how much this stock wanted to go back up, I decided to hold on to what I added today.  After all, it was still an up day today.

As I scrolled through my watchlist, I found $AAPL to be enticing because of the three technical signals I saw. See here. I decided to buy a starter position and placed a GTC stop order below today low.  My stop wasn’t hit today but I am in the red currently.  Since this is meant to be a “bottom catcher” play.  I’m willing to risk the amount where the stop is.  If $AAPL wakes up next week, I’ll be fine; if not, I will take the loss.

Current holdings:

AMRN, LRAD, SZYM, TINY, AAPL, FB, PACB, CERS, BCRX, APRI and 34% cash.

Have a great weekend!

My 2 cents.

@tradingmy2cents

The trades I made in the journal were time-stamped in twitter

Comments »

Did you hear that noise?

Sound like a steam engine of the north-bound train is kicking back into action.

Most of the charts I’m watching now act like they are coming back to life.

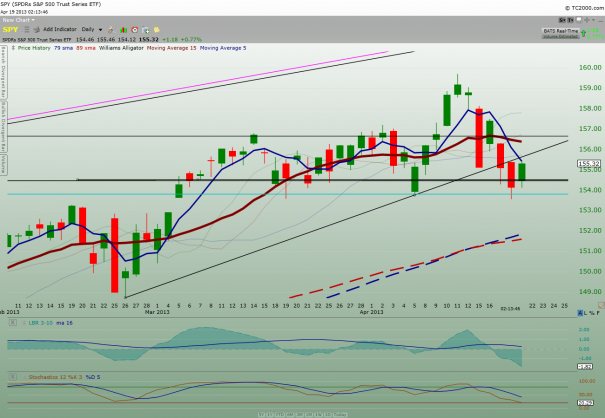
The $SPY daily chart below shows that, again, the Year 2000 high is a strong support. Price again bounces off this support instead of continuing the downdraft from yesterday.

SPY_Daily

The way I see this, we are still in a consolidation range inside these two multi-year highs. Because one successful attempt was made to break out of the 2007 high with several days over it before coming back down inside the range as opposed to zero day breaking down below the 2000 support, I’m cautiously optimistic that the bull is still alive and kicking. Of course, this is a matter of personal interpretation of the chart.

Nevertheless, I see enough today to jump back into stocks I’ve previously disposed of before.

My 2 cents.

Comments »

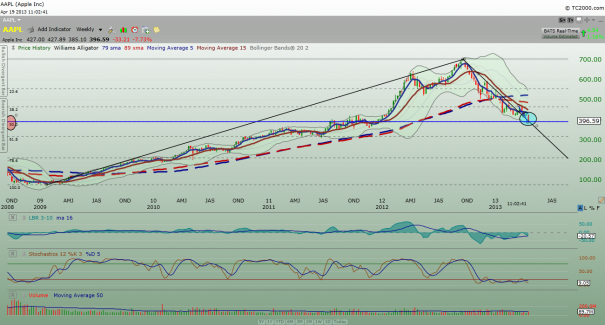
Three technical reasons supporting a BOTTOM for $AAPL

Reason number 1: We are at 50% retracement from the low of Jan 2009 and the high of Sep 2012. See the blue horizontal line below in the $AAPL weekly chart.

AAPL_Weekly

Reason number 2: The length of the drop from the high of 03/25 to the low of 04/5 is equal to the length of the drop from the high of 4/11 to the low of 4/19 (today).  See the blue zig-zag line.

AAPL_dailly

Reason number 3: We have a bullish piercing candlestick pattern in development today.  See the two candlesticks inside the circle.

Below is the primer for bullish piercing candlestick pattern:

Piercing Pattern

The piercing pattern is made up of two candlesticks, the first black and the second white. Both candlesticks should have fairly large bodies and the shadows are usually, but not necessarily, small or nonexistent. The white candlestick must open below the previous close and close above the midpoint of the black candlestick’s body. A close below the midpoint might qualify as a reversal, but would not be considered as bullish.

Just as with the bullish engulfing pattern, selling pressure forces the security to open below the previous close, indicating that sellers still have the upper hand on the open. However, buyers step in after the open to push the security higher and it closes above the midpoint of the previous black candlestick’s body. Further strength is required to provide bullish confirmation of this reversal pattern.

CIENA Corp. (CIEN) Candlestick Piercing Pattern example chart from StockCharts.com

In late March and early April 2000, Ciena (CIEN) declined from above 80 to around 40. The stock first touched 40 in early April with a long lower shadow. After a bounce, the stock tested support around 40 again in mid April and formed a piercing pattern. The piercing pattern was confirmed the very next day with a strong advance above 50. Even though there was a setback after confirmation, the stock remained above support and advanced above 70. Also notice the morning doji star in late May.

And for these three reasons, I’m comfortable to buy some $AAPL this morning.

My 2 cents.

Comments »

Today Portfolio Adjustment (04-18-2013)

Today was a sell to close only and no buying.

Market opened almost neutral.  A little tug or war here and there and then BOOM! price began to tank.

I saw $BCRX playing defensive right at the opening gate and I was going, “Wait a minute! Ain’t you supposed to gap up because of the dire news on possible human-to-human transmission?”  No, the prices was having trouble keeping up on the high $1.9x area so I figured the situation in China might actually be better.  Without further thinking, I started selling $BCRX by chunks and eventually sold down to 80% of the original position for a small losses.  As time wore on and price didn’t seem to come back up, I sold the other 20% and called this gamble a breakeven.

Maybe, just maybe, $BCRX will gap up tomorrow without me.  What?  You think like this too?  Hmm, this is  a very common follow-up thought for a lot of people who have made up their mind to cut losses.  The way I see it, if thinking like this help you to cut losses, why not?  Half of the time when prices take a dumper after we’ve sold, we secretly pat ourselves on the back to congratulate ourselves on a job well-done.  And the other half-of-the-time, we simply say, “I knew it!”  There is nothing like proving yourself “right”, eh?

$APRI began to drop off and I immediately took action to sell as well.  Following $APRI, I sold $CERS as well.  Took small losses on both.

With general market continued to head south, I decided to reduce further my $SZYM investment as well.

After raising cash to 60% level.  I called it a day and stopped watching the market.  I don’t want to short because we may have a bounce next week due to 4/5/2013 support.  And I don’t want to buy because I don’t know if the 04/05 support will hold.  This leave me with a very comfortable cash position to wait it out.  Let’s see what happen tomorrow.

I did not take a very active approach to the market or my contribution to ibankcoin this week due to my catching a flu earlier in the week; if some of you are thinking I’m running out of gas, not quite yet!

My 2 cents.

Comments »

A Call from Next Week

Yes, we will get a call from next week to find out if 4/5/2013 low will be a support from today down day.

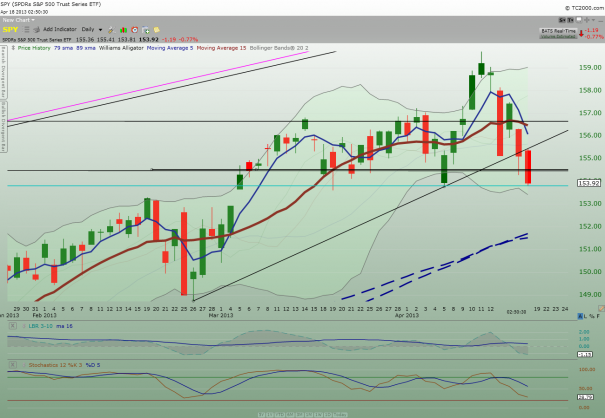
Take a look at the daily $SPY chart below:

SPY_Daily

It looks like 4/5 low is holding the ground for now with one hour to go.  Regardless, we will know next week how it will play out.  Meanwhile, I’m not going to sit heavily in stock waiting for judgement call.  I’ve been downsizing some of my position this morning and my cash is now 60%.

There is really nothing for me to do but to relax and rest.  Sometimes, you need to let the market goes and give it time to “digest”.  And it will be much easier to relax if you adjust your portfolio to increase cash.  If you are still heavily invested, some of you are likely to be tense and worrisome which is understandable giving today continuing bear stance.  For those who have a hard time moving from stock to cash: try this exercise, think of $CASH as a stock.  So, you will sell stock $ABC to buy stock $CASH.  That may do the trick.

Be safe.

My 2 cents.

Comments »