That’s right! If you have an Android phone, you can now install Facebook on your home screen and you will have Facebook facing you everyday. Wow! Isn’t that fantastic?
Yes! Yes! It is absolutely fantastic because the stock price has been going up. With regard to the Android Facebook home screen, I leave it to you to decide.
Take a look at the 10m $FB chart below:
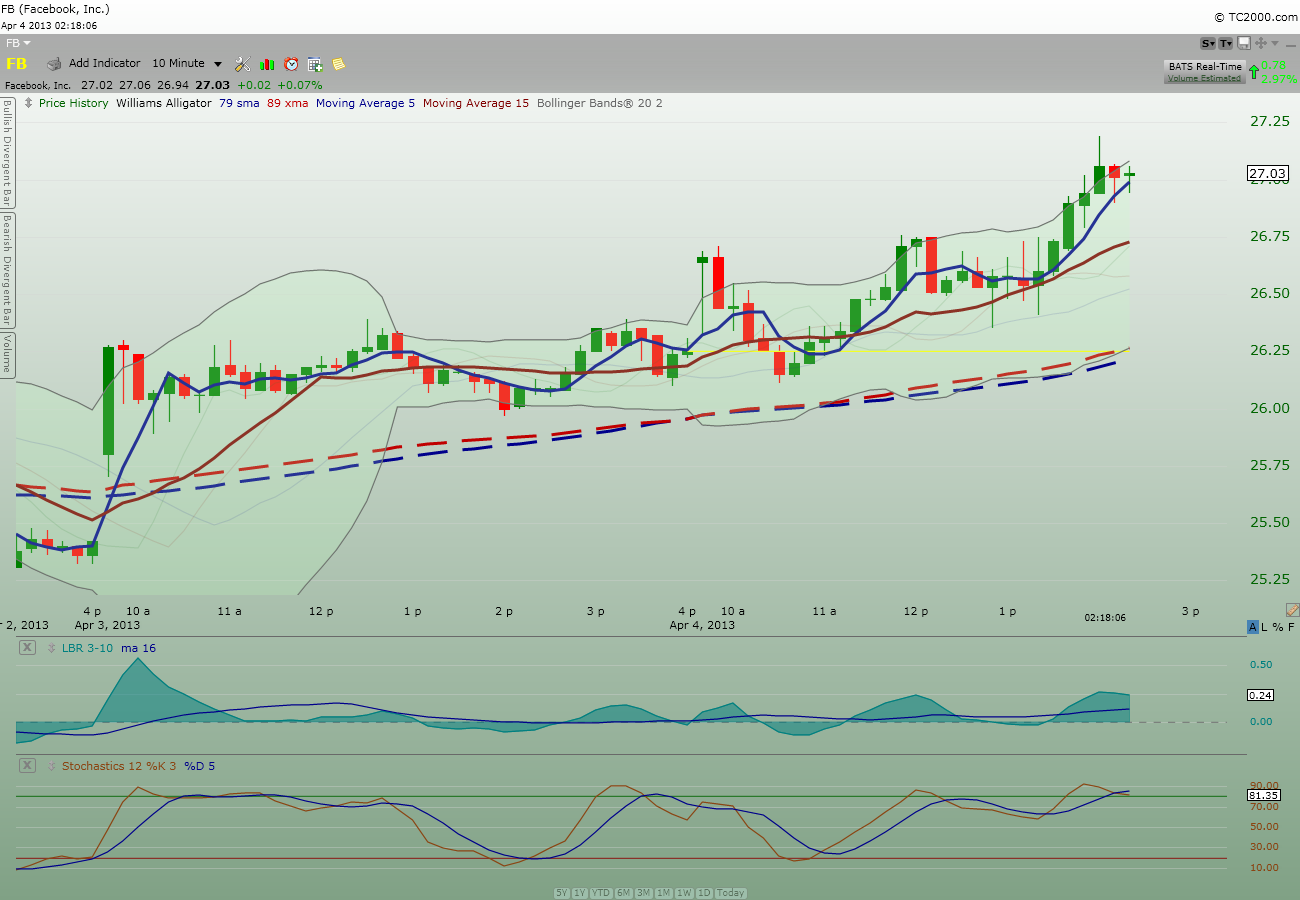
Isn’t that a beauty? Although I had a close call of almost getting stop out at breakeven. Thanks goodness price never got to my stop. Whew! However, when $FB started to bounce near my stop, I added some more. I also added more when it got to the high $26.xx area.
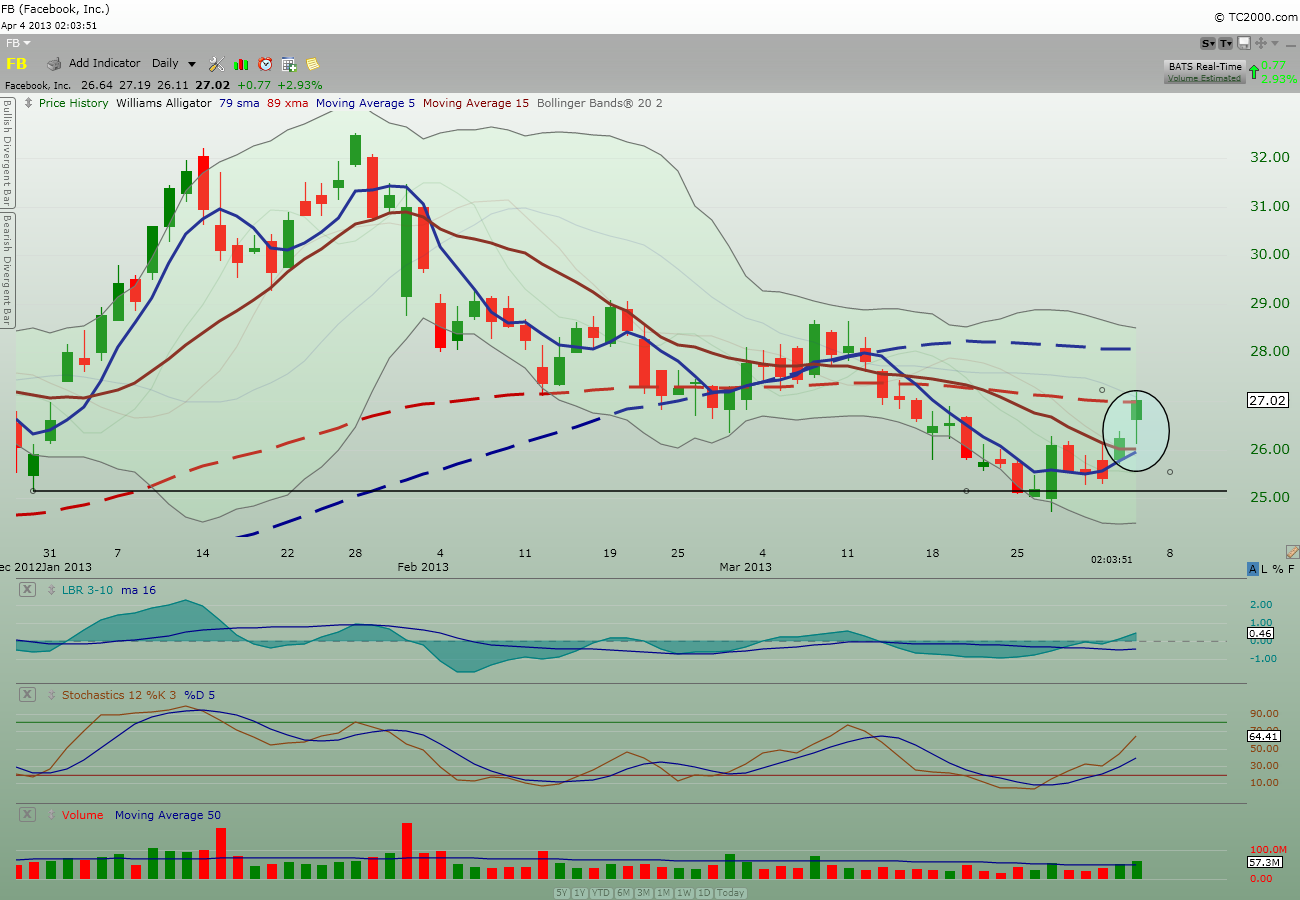
Below is the daily chart.
Notice that the 5m moving average line is going to be crossing the 15m moving average line. This is confirmation of a bottom here. At least, it improves the statistical significance of a bottom being formed.
My 2 cents.
If you enjoy the content at iBankCoin, please follow us on Twitter

I want to know and I’m not trying to be a smartass. Sometimes messagescome across that way. Why is this 5m/15m cross different than the 3/7/13 cross of the same averages? Why was that not a bottom? Is it because of other indicators on your chart?
Hi Dix. 5m/15m cross happens to be my flavor of the month. I was reading this book “Trading Full Circle” by Jea Yu and Jea used 5m/15m cross; so naturally I want to try it.
As to “Why was that not a bottom?”, I’m assuming you are asking why is $FB not making a bottom yet. The way I see it, to be called a bottom, price action needs to take out the previous pivot high set in Mar 7th @ $28.67. Taking out this high changes the current general direction of being down. Don’t forget, $FB is currently still in an on-going downtrend. Just because it is bouncing off from last week low doesn’t mean a bottom has been set; it may just be another dead cat bounce before continuing on with the downside direction. Look at the last two bounces in Feb and Mar; both were unsuccessful and price eventually headed lower to Mar 27th low.
My other indicators on the charts are simply “supporting tools” for me to make my decision. Did you see how both of the momentum indicators below turned up? It was because they were all turning up that I got my confidence to buy and add to my position today.
To me, it is not “why is the moving averages or indicators different from others and so on”; but more on “which moving averages and indicators give me the most confidence to make a decision.”
There are multiple ways in using moving averages, momentum indicators, and other exotic technical tools available; and NONE of them can guarantee high probability success consistently all the times. Therefore, to deal with those times the “technical tools” fail (and they will fail again and again), you need to find ones that you personally like or have some good “feel” because of your own understanding and knowledge of the tools. Thus, when the tools fail, you will accept them as part of the game. Otherwise, you can be constantly caught in a state of indecision because you do not “trust” the signals giving by the technical tools on the chart.
In summary, all technical tools have the same equal chance of helping you; you just need to find the ones that you feel the most comfortable. If the 3/7/13 is your preference, go with it.
Hope it helps.
Cheers!
Btw, moving average crossing by itself only increase the probability that the direction will continue in the direction of the cross; but it does not guaranteed the direction. Notice that in early March, the 5m actually cross the 15m and yet the bounce failed and price headed back down.
I also like to watch where the price action is in relation to the moving average line itself. Even after crossing, if price action falls below the moving average line, my alert goes up and I’m ready to hit the sell button…