iBankCoin
Joined Nov 11, 2007
1,458 Blog Posts

Fidelity Select Sector Rotational System Year-to-Date Results

See the year-to-date results of Version 1 and Version 2, as well as the top ranked Fidelity Select Sector funds, below.

Version 1 Results:

  • Net Profit: 3.84%
  • Max System Drawdown: -9.96%
  • Avg Profit / Loss: 1.14%
  • 11 Trades
  • 45.45% winners

The system is currently long FSUTX, FIUIX, FSRPX. Click here for the list of Fidelity Sector Funds.

Version 1 has ranked the top three Fidelity Select Sector Funds as follows:

  1. FSUTX
  2. FIUIX
  3. FBIOX

Version 2 Results (this version is in an evaluation period and is not being traded live):

  • Net Profit: -6.41%
  • Max System Drawdown: -9.66%
  • Avg Profit / Loss: -1.43%
  • 18 Trades
  • 33.33% winners

The system is currently long FSUTX, FIUIX, and FDFAX.

Version  2 has ranked the top three Fidelity Select Sector Funds as follows:

  1. FSUTX
  2. FIUIX
  3. FSTCX

This version is beginning to worry me. Specifically, it may be curve fit. We’ll give it a few more months and then review how it was constructed. You might remember we took great pains to ensure it wasn’t curve fit, but it might be anyway.

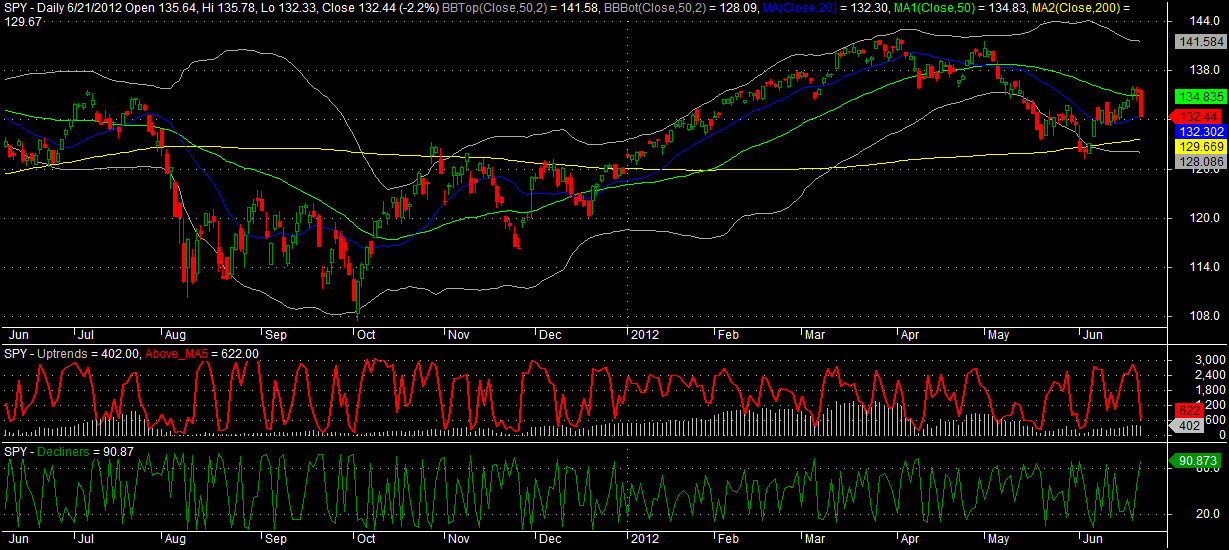
These systems are benchmarked against a SPY Buy and Hold, which year-to-date has gained 6.13%

I have written a ton about these systems. If you want to read more, look at the categories to the right: Fidelity Select Rotational Strategies.


Comments »

ROC Indicator Closes Long, Goes Short

This simple indicator continues to handle the year’s whipsaws quite well. Trading SPY with the indicator has resulted in a year-to-date net gain of 10.16% while a buy and hold of SPY has yielded a gain of only 6.23%.

The indicator signaled short at the close on July 3rd, effectively shorting exactly at the recent high.

Because it was designed with a much longer time horizon, I’m still not sure how well the indicator will handle all this whipsawing. So far, so good.

To read more about this indicator, there are many posts on it housed here.

Comments »

Sunset Over Siesta Key, Florida

After 30 hours of driving and 3.5 days of Tropical Storm Debby, I’m home. Our vacation is over, and it feels like we were cheated.  We had 3 fantastic beach days and almost 5 days of driving and tropical storminess. The kids had a great time so I guess that is all that matters.

The weather finally broke Tuesday night presenting us with a  perfect beach day on Wednesday. I made the video of the sunset that evening.

Once the weather broke, I didn’t even take one look at the market. I’ve now got all my data downloaded and see that we had a powerful bounce, just as my post last Friday was calling for. I’m off now to read and catch up on what the other iBC bloggers have been seeing and saying about this market.


Comments »

Tropically Depressed: Live Video Blogging Tropical Storm Debby

A couple of videos and a brief update from Siesta Key, Florida.

Stayed tuned until the end of the video for my analysis.

The next video is the street side.

The poor ladies who were cleaning the unit above got soaked. I saw it coming but didn’t have the heart to video their misery.

Many more video updates are coming, including from the beach…

Comments »

Tropically Depressed at the Best Beach in America

We’re getting blown by tropical storm Debby over at Siesta Key Beach. I’m telling you that right now, this beach is definitely NOT the best beach in America. In fact, just about any other beach in America is likely better. I hadn’t planned to do a lot of blogging over this week, but it is looking like the tropical storm rain and wind is going to stick around for days. This definitely sucks. Perhaps the only redeeming factor of the “vacation” is that I have lots of family staying here too. My children will thankfully not be too bored couped up indoors since they have cousins to play with.

More later from “America’s Wettest Blogger.”

Comments »

Breadth Indicators Suggesting a Bounce

Two breadth indicators are at levels which suggest a bounce is near.

The middle pane, red line, is the number of stocks trading above their 5 day moving averages. At this level, this indicator is suggesting that a two to three day bounce may develop.

The lower pane, green line, is a measure of the number of stocks that declined. It is nearing extreme territory. When it gets to these levels, it usually means a bounce, or at least some stability, is imminent. However, this signal can be taken off the board by only one day’s worth of stability.

Based on these two indicators, what I am seeing is that a bounce is near, and it may last for as many as three days.

This post was written before the market opened to be published at 11:00 a.m.

Comments »

Fidelity Sector Funds Rotational System to Re-enter Market Tomorrow

The Fidelity Select Sector Funds Rotational System Version 1 has been out of the market since May 14th. Since $SPX has closed above its 50 day moving average, the system will re-enter at tomorrow’s close. Let’s take a look at the top ranked sector funds as ranked by Versions 1 and 2.

Version 1 Top Ranked Funds

  1. FSUTX – Fidelity Select Utilities
  2. FIUIX – Fidelity Telecom and Utilities
  3. FSRPX – Fidelity Select Retailing

Version 2 Top Ranked Funds

  1. FSUTX – Fidelity Select Utilities
  2. FIUIX – Fidelity Telecom and Utilities
  3. FSRPX – Fidelity Select Retailing

Both versions are in agreement.

Version 1 will purchase the top three funds at tomorrow’s close. Version 2 (still in real-time evaluation) re-entered the market on June 15th. It is long FSUTX, FIUIX, and FDFAX (Consumer Staples).

Tomorrow evening I’ll post an update with the performance of both versions.

Read more about these rotational systems here: Version 1. Version 2.

Comments »