iBankCoin
Joined Nov 11, 2007
1,458 Blog Posts

Shorts Beware: $SPY Abnormally Strong

I have written many posts about abnormal markets. On Friday, $SPY met a basic criteria for being abnormal with a bias to the upside.

There are times to short and there are times sit on our hands. How do we determine when to short and when to sit? One method I like is to use the upper Bollinger Band (50,2) as an abnormal market filter. I have found through backtesting that a close above the upper BB signals a market that may be entering or continuing a sustained uptrend. In other words, it is a market that is less-likely to revert to the mean and more likely to trend. This may be counter-intuitive as we typically view a market that has been sharply rising as one that is due for a correction, or at the very least, a pullback. What I have found after a close above the upper Bollinger Band is that instead of a sharp pullback or correction, we see some consolidation and then a resume of the uptrend.

Let me demonstrate.

The Rules:

  • Buy $SPY at the close if the close yesterday was NOT above the upper Bollinger Band AND the close today IS above the upper Bollinger Band (50,2).
  • Sell $SPY at the close X days later.
  • No commissions or slippage included.
  • All $SPY history used.

The Results:

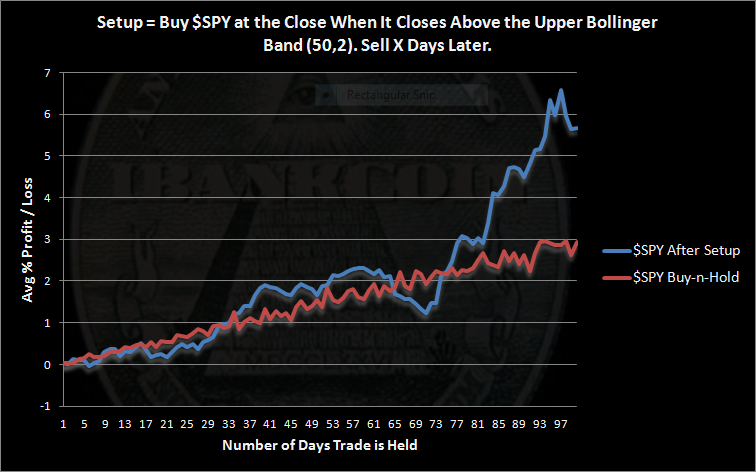
There were 123 occurrences of this setup with 27 being held for the full 100 days.

These results compare buying $SPY according to the rules above vs. buy and hold. To generate the buy and hold results and have them comparable, I split all of the $SPY history into 100 day segments and then averaged the segments.

The buy and hold results show the clear bias to the upside that has been prevalent over the past 20 years. The setup results show a market that has closed more than 2 standard deviations above the 50 day mean and still manages to climb almost 2 months later to close higher on average than buying and holding. After this setup, the market has tended to surge, and 100 days later has averaged a return of almost twice what we would expect with buying and holding.

And that is why this triggers the abnormal market filter. It is not a market that we want to aggressively short. We may also not want to be aggressively long. The results show we may have a few weeks to consider our positioning and bias.

The bottom line is that I am looking for the market to trend more than swing. These results suggest that the swings may be less predictable and the market may shrug off bad news as it climbs the wall of worry.

Comments »

$SNFCA Continues Its Ascent

I brought to your attention $SNFCA in my recent high tight flag screen, published Wednesday night. The stock is now up more than 7% since it was flagged.

The stock has broken out of a descending triangle but has yet to pierce overhead resistance. Bulkowski’s rules for high tight flags trigger a buy when price gets one penny above the top of the flag pole. For SNFCA, this breakout price is $11.47

Comments »

2012 Results for Fidelity Select Sector Fund Rotational System

I have followed this system for 3 years now, and have traded it live since February 2012. I am happy with its performance and will keep trading it.

2012 Results, buying the first trading day of January 2012 and holding to December 31st:

  • Net Profit = 8.47%
  • Max Drawdown = -10.06%
  • Risk Adjusted = 10.93%
  • Number of Trades = 20
  • Avg % Profit / LossĀ  = 1.32%
  • Winning % = 50%

However, if the system had been traded in 2011 and those open trades held into the beginning of 2012, then the compound annual return for 2012 is 11.8%. With $SPY doing 11.7% for 2012 (not including commissions or slippage), I find this return to be very respectable. Keep in mind that there are no commissions or slippage generated from trading Fidelity Select Sector Funds.

The system is very simple to trade and is sustainably traded by just about anyone with a Fidelity account and about 30 minutes a month of free time to devote to it.

The system is currently long the following funds:

FSHOX (Construction and Housing)
FSPCX (Insurance)
FSAVX (Automotive)

Here is a link to the funds the system trades: Fidelity Select Sector Funds

Equity Curve: Click on chart to enlarge…

I am honestly excited about continuing to trade this system, and if you have ever traded a system for any length of time, you understand how hard it is to feel comfortable enough to trade it by the rules and still enjoy the process.

Comments »

$SPY Gaps Up More Than 1.75% and Closes Higher Than the Open. Bullish or Bearish?

After the last 2 crazy days in the market, I’m going to bang out a few more studies to try and figure out what is going on. This study builds on tonight’s previous study – $SPY Gains More than 4% in 2 Days. Bullish or Bearish?

The setup is simple enough. $SPY gaps up more than 1.75% above the previous close, and then closes higher than the open. I added 2 modifications to that setup, which I’ll discuss below.

The Rules:

  • Buy $SPY at the close after the open gapped up more than 1.75% above the previous close and the close is higher than the open.
  • Sell $SPY at the close X days later.
  • No commissions or slippage included.
  • All $SPY history used.

The Results:

First we’ll discuss the results of the setup (blue line). There were 38 occurrences of this setup, with 19 held the full 50 days. Sample size should be a concern. On average, we have gapped down the next day after the setup. Over the next several days, $SPY has tended to trade beneath the gap-day close. Ignoring the small sample size, this setup has yield neutral results over the next month and would not beat the average $SPY buy and hold trade over 50 days.

Modification A: This is modification removes the requirement that the gap day closes higher than the open. I included the mod to get more samples. There were 56 occurrences of this setup, with 25 held the full 50 days. Modification A is also a neutral setup over the first month. Not requiring the gap day to close higher than the open included some trades which pushed the results up to bullish levels after 50 days.

Modification B: This modification is a nod to the previous study. It requires the setup from Modification A and that $SPY has gained more than 4% in 2 days. Because of the specificity of the setup (we are basically modeling almost exactly the last two day’s trading), the sample size is small. There were 22 occurrences of Modification B with 11 trades held the full 50 days. The results are bearish over the next month.

As often is the case, the situation is murky. On average, $SPY has retraced a large gap / large gain over the next few days. Thus, I am looking for a small retrace in the next day or so of less than 1%, and then a higher high. After the higher high is made, I expect that a gap-fill process will begin.

Traders who have not chased here may want to consider waiting a bit longer before getting in, or at the very least, entering in small positions.

Previous and Related Post: $SPY Gains More than 4% in 2 Days. Bullish or Bearish?

For more on gaps, check out Quantifiable Edges recent post: 1% Gaps Higher to Start the Month.

Comments »

$SPY Gains More Than 4% in 2 Days. Bullish or Bearish?

I’ve said over and over how hard it is to find a setup on the indices that produces a bearish result over an intermediate term. Almost all setups confirm that the market likes to go up more than go down. Imagine my surprise to find that the past couple of days have made a truly bearish setup.

The Rules:

  • Buy $SPY at the close when it gains more than 4% in 2 days.
  • Sell $SPY at the close X days later.
  • No commissions or slippage included.
  • All $SPY history used.

The Results:

Some Additional Stats:

Next Day Winning Percentage: 47.62%
5 Day Winning Percentage: 60.00%
Number of Setups: 63
Number of Trades Held 50 Days: 22

It looks like another spike higher is to be expected over the next week. But if history is our guide, any move higher should be sold. $SPY has fallen, on average, greater than 2% over the next 3 weeks.

Previous Post: High Tight Flag for Thursday

Comments »