iBankCoin
Joined Nov 11, 2007
1,458 Blog Posts

VIX’in To Die?

VIX

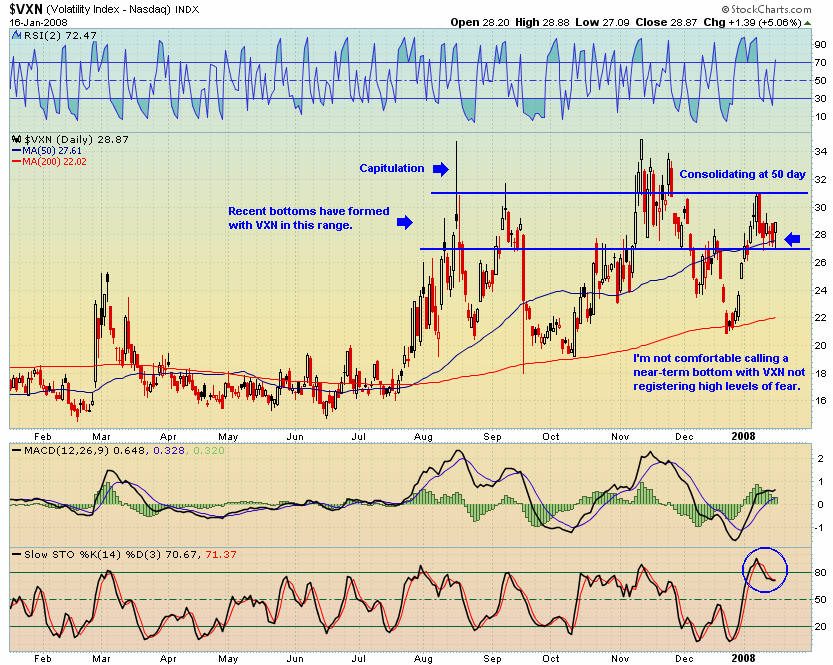
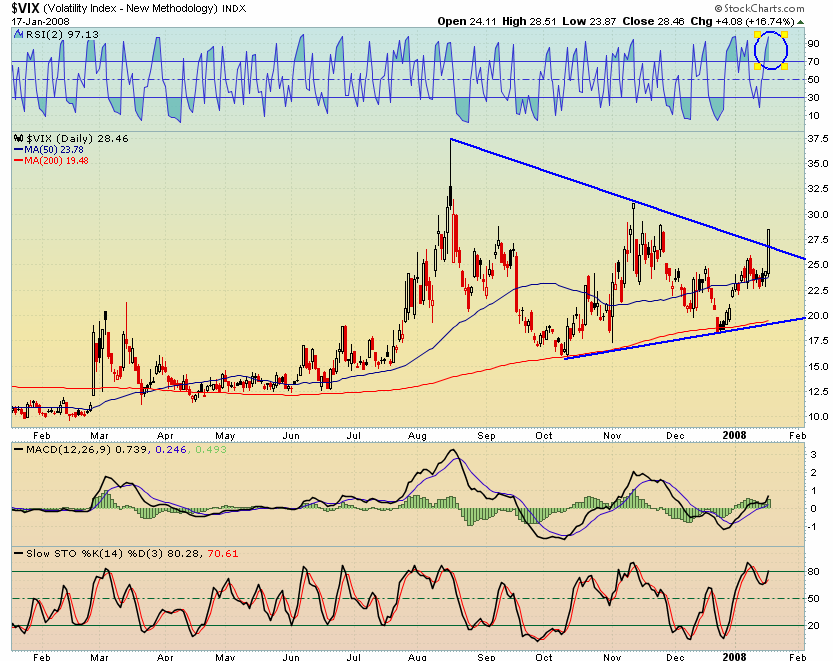
The Volatility Index was up over 16% today, breaking above a triangle formation. I remarked last night that I would not even consider watching for a bottom until the Volatility Indexes (VIX, VXN) spiked near previous highs. That spike has now begun.

Keep in mind that this is a measure of fear in primarily “professional” traders.  Extreme levels are often associated with turning points in the markets.

I have to say that I am very nervous about going in to tomorrow net short. With the President speaking on a stimulus package, the chance of a surprise rate cut by The Bearded One, volatility spiking, and an oversold market, we have all the recipes for a violent snapback/oversold rally. This could be a brutal reality for those who are unprepared.

Or, this breakout could mean that volatility will continue to increase, and could surpass previous highs.

Comments »

The Daily Breakdown: XLB

XLB

I’ve been wanting to get short Basic Materials via [[SMN]]. I’ve been watching the ETF trade, and missed a good entry last week. I’ve realized that there is something about SMN that I do not like. Maybe it is the volatility, or the lack of liquidity.

In contrast, [[XLB]] is very liquid, trading almost 20 million shares today. (I apologize for leaving volume off of the above chart.) The chart is a short-setup dream, with failures at the major moving averages in the midst of a huge topping process. Ideally XLB will bounce a bit and give an entry closer to the moving averages.

Included below are the components of the ETF. I especially enjoy the opportunity to be short [[MON]].

Here is the link to the website with more information about XLB: Materials Select SPDR Fund XLB

XLB holdings

Comments »

Show Me The Fear and I’ll Show You A Bottom

Nasdaq January 16, 2008

The charts are showing conditions that are ripe for a bounce, yet the Nasdaq Volatility Index is not showing the extreme levels of fear necessary for what I call a tradeable bottom.

The above chart shows that today’s action has many similarities with other bottoms over the past year. There is a surge in volume, there are bullish divergences in the MACD, and the candle is a doji with a long tale. These are exactly the kind of signals we want to watch for as we look for a bottom.

However, something about today’s action just didn’t feel right. I still sense resignation and complacency. It seems to me that some are resigned that the market will fall farther, while others are adopting a wait-and-see attitude before jumping back in on the long side. That is not the recipe for a bottom.

In fact, the VXN confirms this.

Nasdaq Volatility Index

Despite the new lows on the indexes and the insipid negative press concerning the economy and market, the VXN is still a good distance from its previous highs. My gut tells me that there is too much going on in our financial and economic systems for this bottom to form on a whimper. This downtrend needs to end in a Bang! and the VXN says we are not there yet, even though other recent bottoms have formed at these levels.

It is conceivable that we do bottom, with little fanfare. It has happened before. If that happens, I will likely miss some entries on the long side. What I’m looking for is close to 4 billion shares to trade on the Nasdaq, volume explosions on the other indexes, and the VIX and VXN to either make new highs or challenge previous highs. I believe strongly that any bounce that is not preceded by extreme levels of volume, fear, and pessimism is not to be trusted.

Comments »

FXI Bands The Global Bull

FXI Breakdown

This breakdown in [[FXI]] is large and should not be discounted. It has failed at the 50 day and is well on its way to test the 200 day average. As bearish as this is, remember, it takes the bands a while to work and achieve the desired effect on the bulls. Read here for a primer: Bulls Get Banded. Also, if you are fan of breakdowns out of triangles, read my previous post HERE where I highlight the FXI triangle.

Some emphasis should be placed on the fact that FXI is not oversold, and has plenty of room to develop momentum on the downside before bouncing.

However, as the bulls’ are still in possession of their business, it is likely that there will be a lot of talk about the Olympics, the U.S. being only 20% of the Chinese economy, blah blah blah, and all this will definitely create a volatile trade.

Most importantly, should FXI trade beneath its 200 day average, it will be within the Bear Market zone. That may put a damper on the global growth and decoupling theories.

Comments »

The Daily Breakdown: Think Locally; Short Globally

IFN: Mumbai, Bye!

Mumbai, bye India. Regardless whether the global growth story will survive a U.S. recession, India, Brazil, and China will give up some of their large gains in the process of figuring it all out. 

India, [[IFN]], [[INP]] is rolling over and looks ready to challenge a 6 month trendline. IFN has challenged resistance 3 times, and has failed, on volume. Would you sell your IFN here for a certain gain or wait around to see whether there will be a decoupling?

INP

INP put in a nasty topping formation. If it does not see a 10 point down move tomorrow, then it is because something crazy happens, like a surprise helicopter visit by the bearded one. Again, watch the trendline, and note the building momentum in the MACD.

EWZ

Brazil, [[EWZ]] failed at the 50 day average and looks to challenge the lower boundary of a triangle pattern. The volume over the last weeks has been above average which means it might be from distribution, rather than consolidation.

I would not be surprised at all to watch Global Growth Bulls fight the dying of the light in these ETFs. Therefore, look for Head and Shoulders-like tops to form. Brazil looks like it has nearly completed its topping formation and may be the first to go. 

Comments »

The Daily Breakdown: SPY Completes Head and Shoulders Pattern

SPY 3 Year Weekly

Take a look at this 3 year chart of the SPY. The exchange traded fund that tracks the S&P 500 broke through the neck line of a head and shoulders pattern last week. Interestingly, this neck line also forms the lower boundary of the triangle formation.

Looking at the 3 year trendline, 135 seems a given while lower 130s seem a modest target over the next month. I expect some support at 135.

Do note the Stochastics- over the 3 year trend, they stay overbought for months at a time, but tend to stay oversold for just a week or so. They are currently nearing a level which historically has produced tradeable bounces.

Also note the RSI(2) is approaching levels which have produced bounces, but these bounces tend to be shorter-lived on a weekly time frame than what is produced by the oversold Stochastics. Something that I’m starting to consider is that RSI(2) may bottom and begin going back up towards neutral before the market bounces. This makes sense as there need to be a number of stocks which have bottomed and begin going back up to produce a bounce across the indexes.

Comments »