iBankCoin
Joined Nov 11, 2007
1,458 Blog Posts

The Daily Breakout

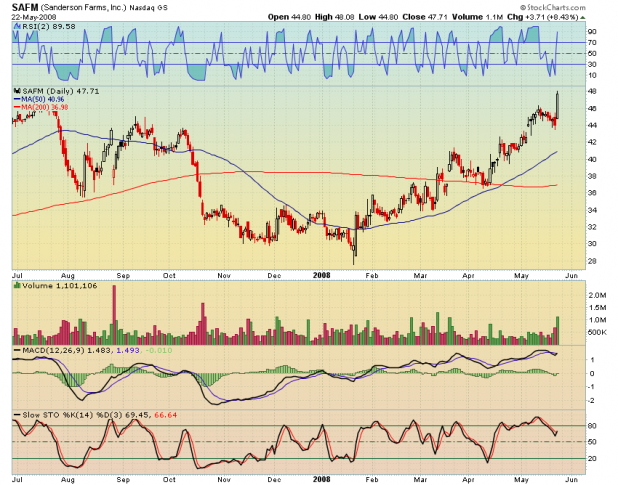
SAFM: Sanderson Farms, Inc., an integrated poultry processing company, engages in the production, processing, marketing, and distribution of fresh and frozen chicken products in the United States.

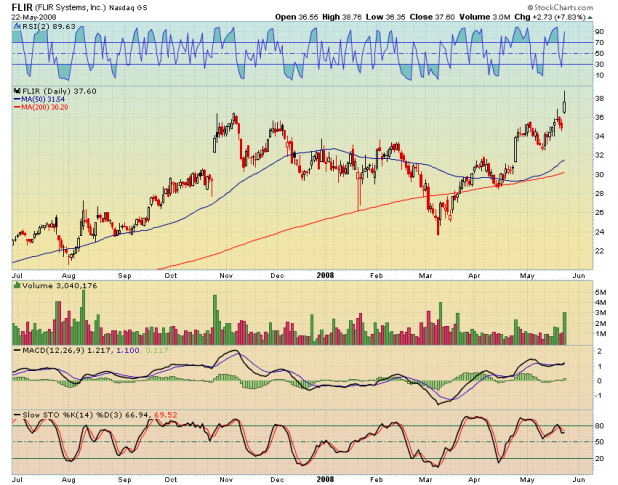
FLIR: FLIR Systems, Inc. designs, manufactures, and markets thermal imaging and infrared camera systems in the United States and internationally.

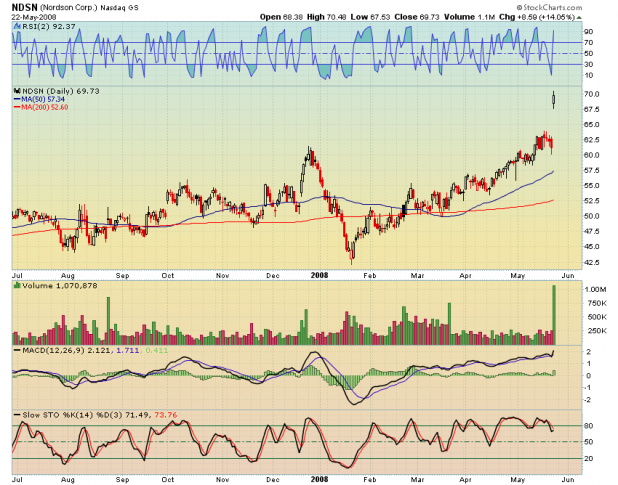
NDSN: Nordson Corporation manufactures equipment used for precision dispensing, testing and inspection, and surface preparation and curing.

I believe that all of these released earnings that beat and surprised. They might all be candidates for PEAD, or Post-Earnings Announcement Drift.

Comments »

RSI(2) Says Go Long, At Open

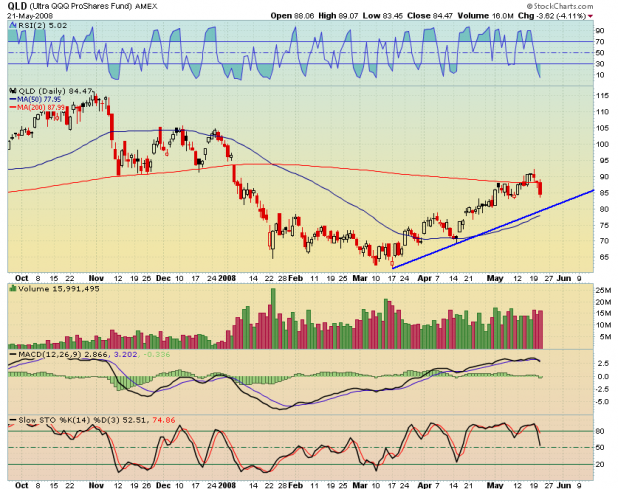
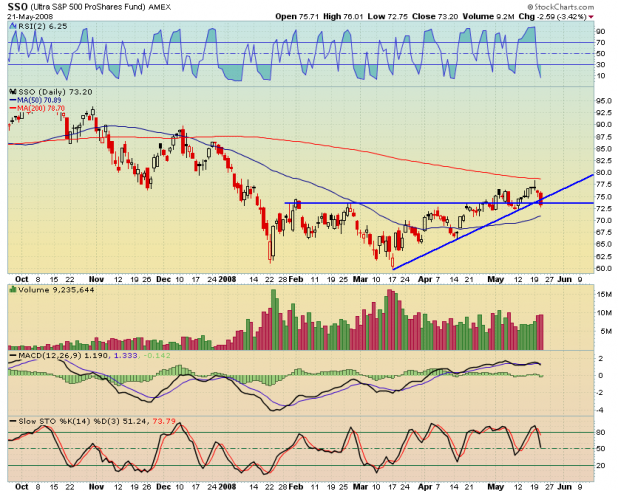
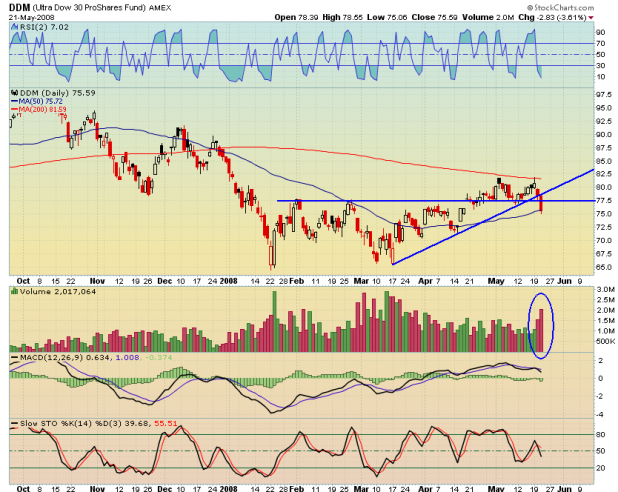
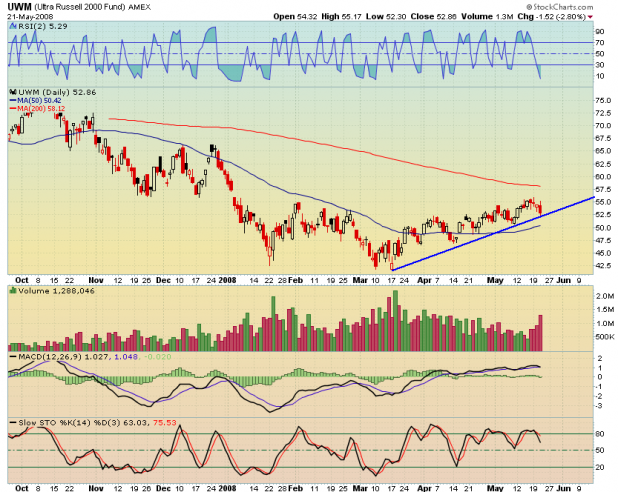
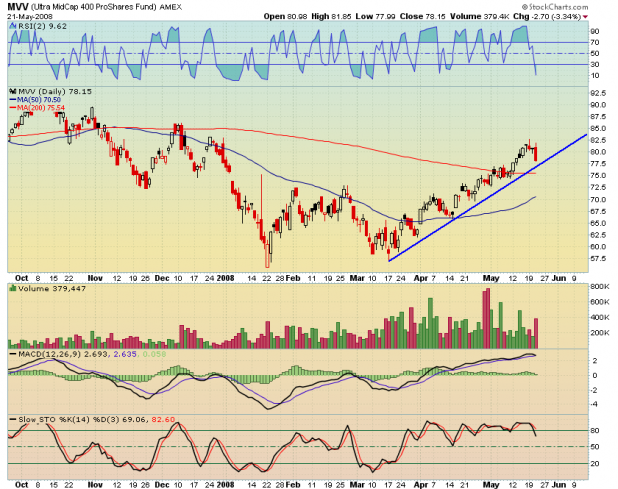
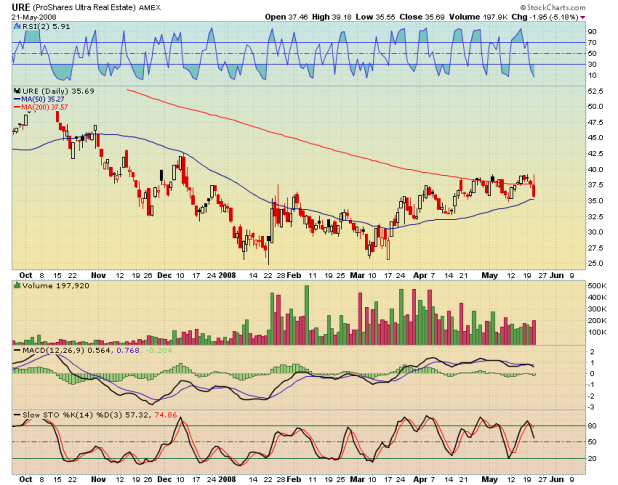
Eight leveraged ETFs made the RSI(2) screen this evening. They are here, in order of largest to least volume.

QLD

SSO

DDM

UWM

MVV

URE

USD and ROM also made the screen, but I got tired of making charts.

I still have more testing to complete for this strategy, but the results so far have been robust. Therefore, I will likely buy 5K of QLD, SSO, DDM, UWM, and MVV, in the morning. This position sizing will leave 50% cash left in the account I am dedicating to mechanical trading.

Should you decide to give this strategy a try, beware that without stops a drawdown of over 30% is possible. However, the system recovers quickly. This fact, coupled with the high win ratio, makes it easier for me to accept the inevitable large drawdown.

Also, I will be selling 300 SDS, bought at $55.26 average, in the morning as the exit trigger has hit. I am approximating a 2 point / ~3.5% gain from the trade. This could go more in my favor if we gap down at the open. The trade would have had a better gain had I not jumped the gun and bought 1/3 a day too early.

This morning, I sold my QID, for a .23 cents loss. This position was also purchased a day too early, or it would have been very profitable.

Finally, from the “Great Minds Think Alike” category, Dogwood has this evening published a similar post on this strategy.

Comments »

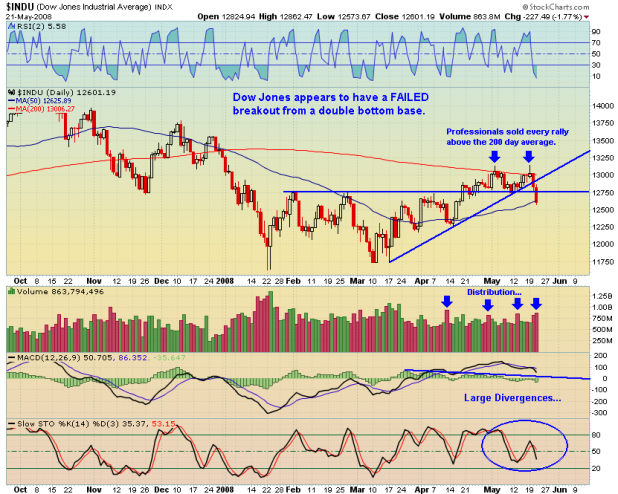
Dow Jones Alert: Failed Breakout from Double Bottom

It seems painfully obvious to me that the professionals have been toying with the retail traders and Joey 401K trader, for the last several weeks. On the Dow chart above, notice the big distribution days, and the long shadows on the candlesticks when they traded above the 200 day average.

It may be important to remember that the Dow was the first index to lead off the March bottom, and it looks like it is still leading–back down, or sideways.

I have not completed any exhaustive research on failed breakouts, but what I have read is that most technical analysts consider a failed breakout to be more powerful than a breakout.

What is clear to me from the Dow chart is that the 50 day average must hold, over the next few days. Should it not hold, then we will have to consider some damned short setups we were using (successfully) just a few months ago.

My guess is that the Dow climbs back up to re-test the 12800 level, within a week.
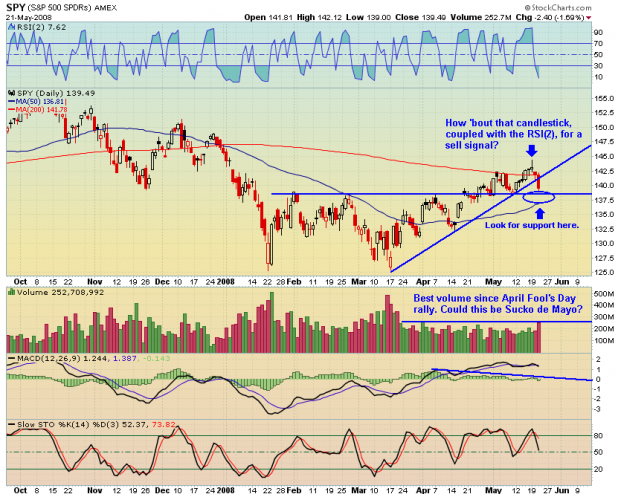
The SPY is again testing its double bottom pivot point. My guess is that it eventually will give way, but I believe it will be defended by the bulls. As Danny noted on his blog, both the Dow and SPY have broken a 2 month uptrend. It pays to be cautious here while we see if the SPY also completes a failed breakout.

I also want to point out that they month of May may turn out to be negative. Do I really need to cite ye olde aphorism?
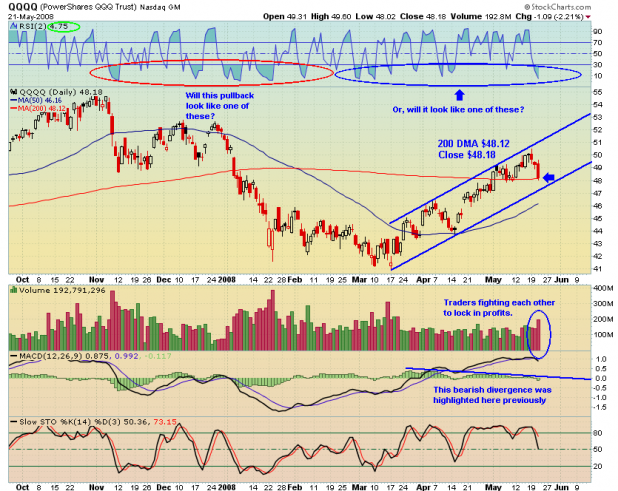
The QQQQ still looks good here. It closed pennies above the 200 day moving average and has not broken its uptrend.

Note the difference in the RSI(2) patterns when the index is downtrending vs. uptrending. Any dip buyers need to keep in mind that if this is the start of a new leg down, we could stay oversold for a painfully long period.

Ultimately, I will be a buyer of this weakness. I started two new positions today (XIDE and MA), and I will place more strategy trades at tomorrow’s open.

I do not have any long term faith in this uptrend. However, the bulls are typically a stubborn lot, and I think they’ll continue pressing their bets, in the near term.

Comments »

What Is Your Account Value?

Average Account Value of iBC Community

What Is Your Account Value?

<10K
10-50K
50-100K
100-250K
250-500K
500K-1 Million
>1 Million
>5 Million
>10 Million
> 25 Million


I thought it might be fun and instructive to get an idea of what kind of size the iBC community is trading.
If I can get a good average, I can use that information to plug in capital amounts during back testing.

Comments »

FXP Has Been Cash Cow for RSI(2) Strategy

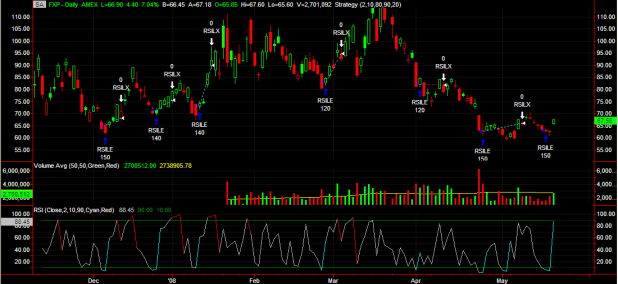
The RSI(2) strategy has been working extremely well on [[FXP]]. The last entry signal was given Thursday for an entry on the open Friday. The latest exit signal was given today, for an exit tomorrow on the open.

The chart above shows the entries and exits with RSILE = Long entry and RSILX = Long exit. A $10,000 account size was assumed with each trade allotted the full 10K. The number of shares purchased is listed below each entry.

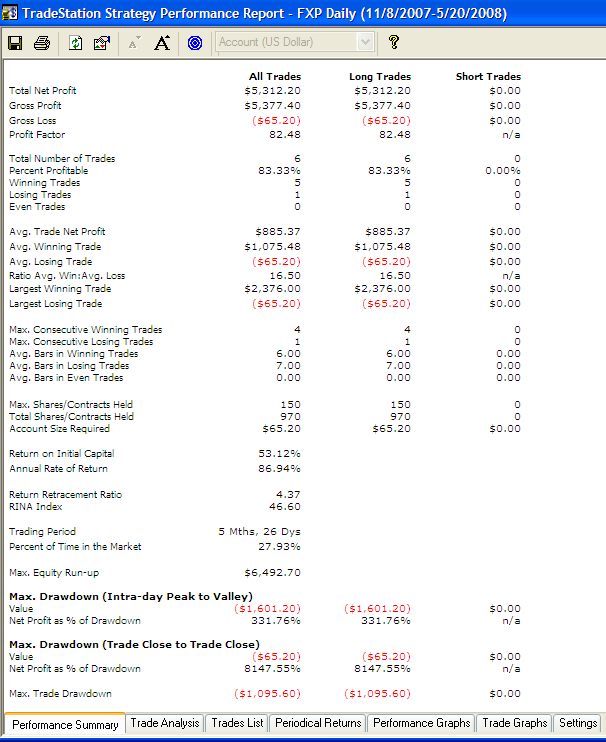
The performance report is listed below. The results are fantastic.

Not included in the performance report is the open trade from Friday. If the trade is closed tomorrow on the open at today’s closing price, add another $650.00 to the profits.

The typical caveats apply here. Past results are no blah blah of future blah blah blah. In other words, FXP may never again work as well for this strategy as it has over the past 6 months. Statistically speaking, 7 trades do not provide enough data to generate significance. On the other hand, should this stategy keep working this well for another 6 months, one will have doubled his initial capital after only one year.

I have yet to develop a stop-loss for this strategy. Stops are not necessary until they are necessary, and every trader has differing squeal points. It looks like setting a stop of around 20% would have kept you in all the trades while risking only 2% of a 100K account.

Comments »

Adding to SDS Position: RSI(2) Strategy

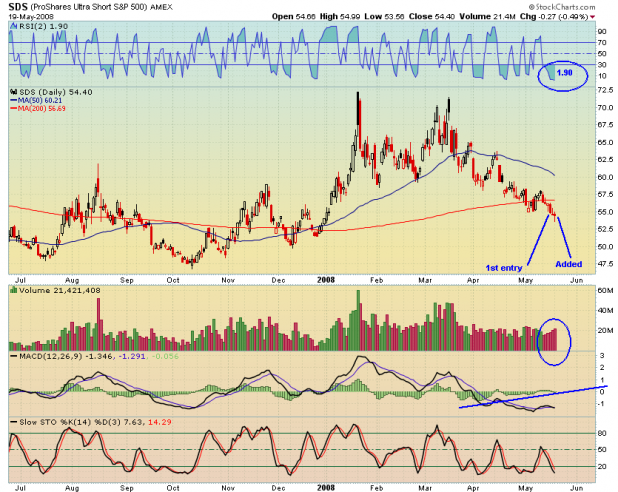
On Thursday, the RSI(2) strategy triggered an entry into [[SDS]]. I took the signal (unfortunately early) and established a postion before the close Wednesday. In order to follow the strategy, the buy of SDS should have occured Friday morning.

The strategy is still signaling entry into SDS as RSI(2) < 10. Therefore, I added to the postion this morning, and since the S&P ultra short ETF is still signaling an entry, I will add to this position on the open Tuesday.

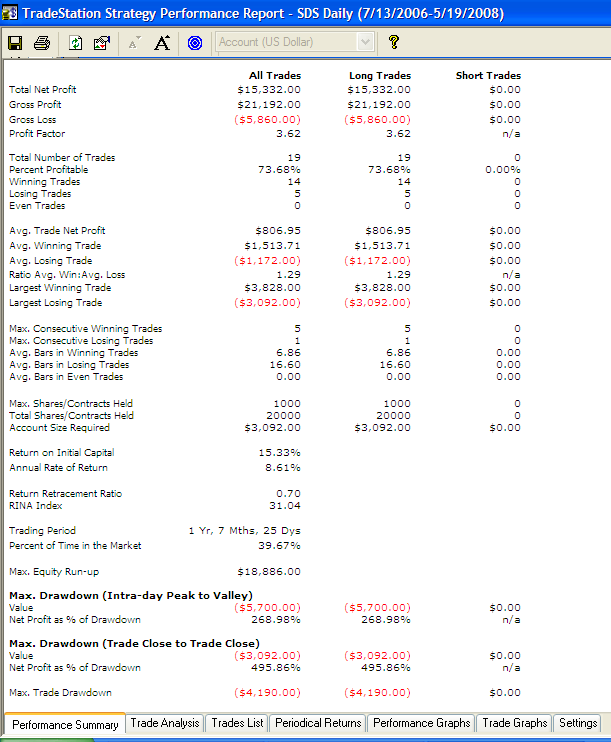
Rudimentary backtesting through Tradestation over the entire history of SDS (just shy of 2 years worth of data) using this strategy yields the following results:

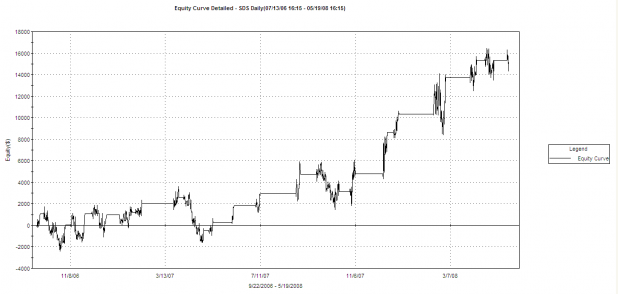
And the equity curve is below:

I do not currently use a stop with this strategy, so beware. The exit triggers when RSI(2) > 80. For the backtesting a 100K account size was assumed, and each position was either all in, or out entirely. I allowed $1.00 per trade in commissions, as that is what it costs me per 100 shares with Tradestation.

Adding a short entry and exit to this strategy doubles the percentage gain and doubles the return on investment, but unfortunately quadruples the drawdown as percentage of starting capital. The results above were from a long only strategy.

Comments »

How To Crack Corn

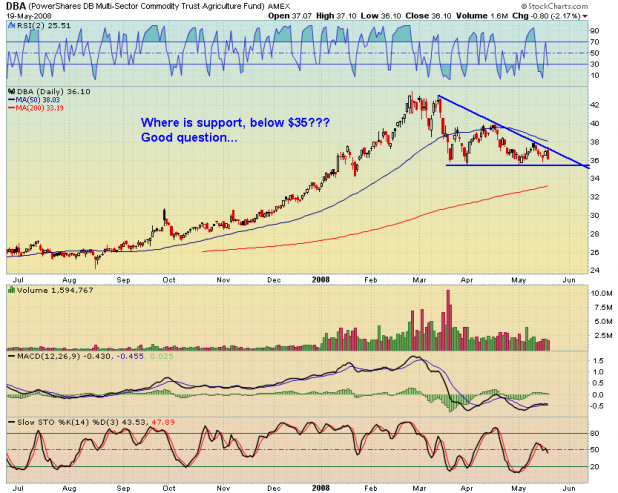
Hat tip to TraderCaddy. [[DBA]] is how one cracks corn, unless you want to wait a quarter or so for [[BWLD]] to reap the benefits. As shown below, DBA gets one exposure to Corn futures of 25%, if I’m reading the holdings correctly.

Company Symbol % Assets
Cbt Wheat (Fut) N/A 2.93
Corn (Fut) N/A 14.6
Corn Future Jul08 N/A 9.25
Red Wheat Fut Mge Jul08 N/A 1.61
Soybean (Fut) N/A 17.74
Soybean Future Jan09 N/A 9.48
Sugar (Fut) N/A 26.3
Wheat (Fut) N/A 9.57
Wheat Future(Kcb) Dec 08 N/A 3.14
Wheat Future(Kcb) Jul08 N/A 10.43
 

As shown in the chart, DBA has formed a bearish descending triangle. A break of $35.00 seems as if it could be catastrophic, as I see no support beneath that level.

Also, the farmer always gets the shaft. Always. No way the American government passes a law giving 10 billion in farm subsidies to farmers AND crop prices continue to rise.

I have no position in DBA, but I am considering entering a short position, at the open of Tuesday, May 20th.


Comments »