iBankCoin
Joined Nov 11, 2007
1,458 Blog Posts

Betting on the Bears This Week

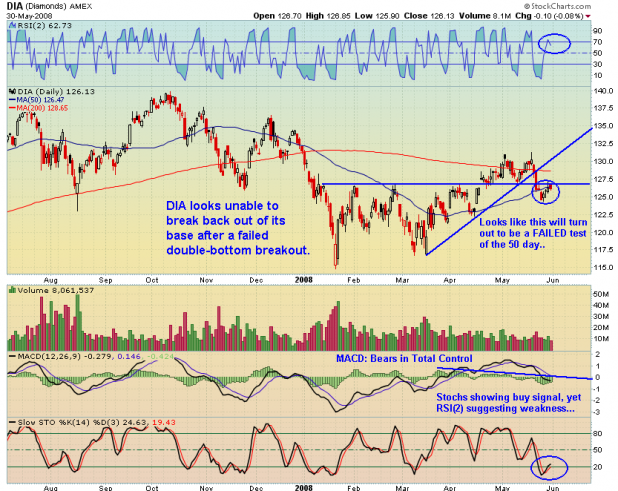
My money will be on the bears as we head into the first week of June. The technicals have been weakening as the momentum from the 2 month bull run subsides. The [[DIA]] is back within its base after a failed breakout, and it looks as its attempt last week to claw its way back out, has failed.

The MACD for the Diamonds has been in negative territory for almost all of May. The RSI(2) reading is not extreme, but is more overbought than oversold. The Stochs, however are giving a buy signal. I believe the Stochs are likely to stay oversold here for a bit longer and that this buy signal should be ignored.

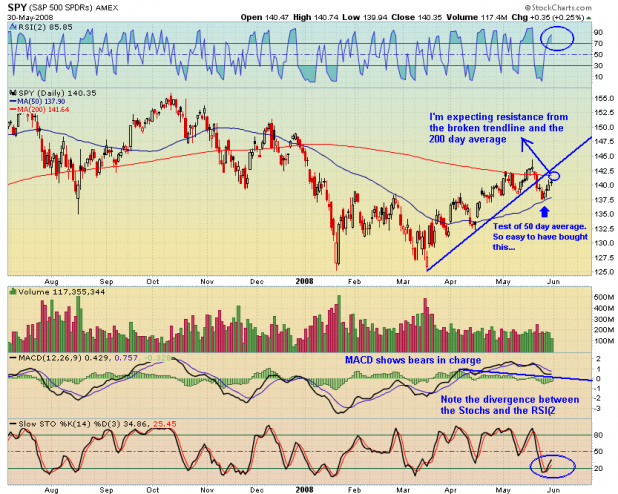
The [[SPY]] has been a tad stronger than the DIA, but has approached its broken trendline from beneath and looks like it has met resistance at the 200 day average. The SPY has a divergence between the RSI reading and the Stochs. Again, I’m likely to take the RSI signal and ignore the Stochastic reading here.
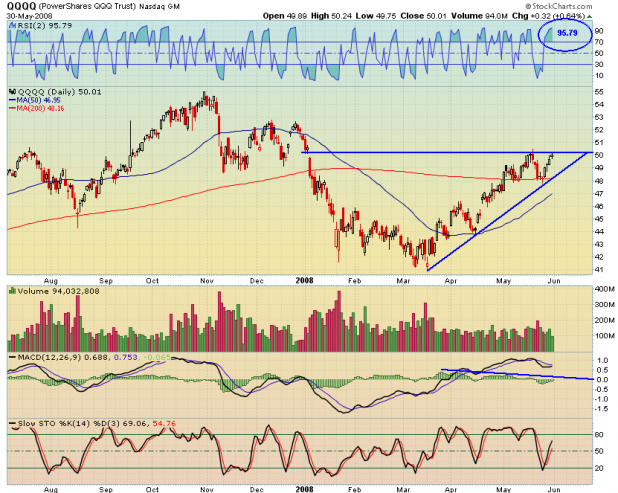
Without a doubt, the [[QQQQ]] has been leading. This chart is very sound, technically. Of course the RSI2 is high, and the MACD is negative, but the ETF has been able to bounce successfully from its 200 day average and is still above its uptrend line, which started in March. That is all very bullish.

However, the Qs were unable to surpass the May high, and they printed an indecisive little candle on Friday. Should there be weakness this week, the ETF will possibly make a lower high. Bears should not ignore the strong support at 48, nor should they forget the rising 50 day average.

Due to these factors, I will open short positions on the indexes, but I am likely to take a smaller position in the Qs, for fear of more strength revving up before any short position can get ahead.

LIkely to cast a pall over trading towards the end of the week is May’s Employment Situation, due to be reported Friday at 8:30 a.m. I think this report will just add to the slowing momentum.

One item of consideration for the Bears should be the statistical edge the first three days of every month have over the rest of the days. Read about it at TraderFeed: Is There a Bias to End-of-Month Trading?

Comments »
The Daily Breakout

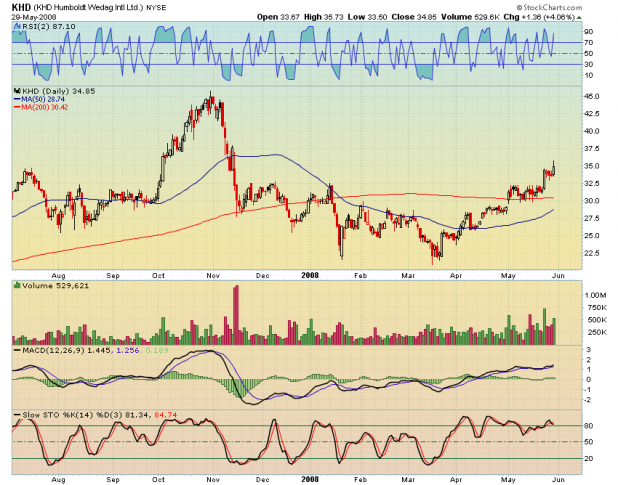
[[KHD]] KHD Humboldt Wedag International, Ltd. operates as an industrial plant engineering and equipment supply company. The company provides equipment, and engineering/design services for cement, and coal and mineral processing industries.

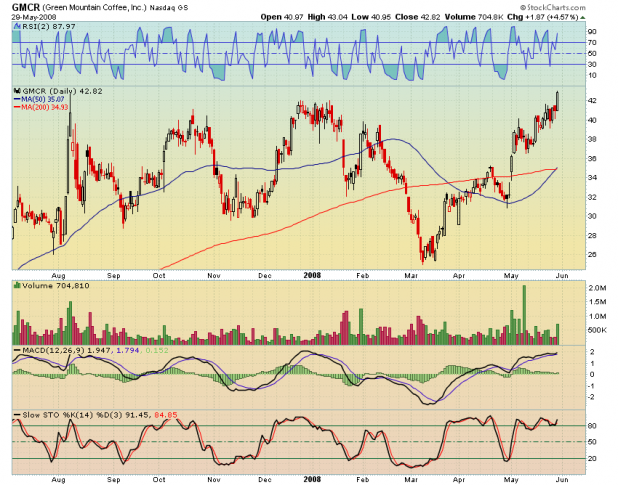
[[GMCR]] Green Mountain Coffee Roasters, Inc., through its subsidiaries, engages in roasting, packaging, and distributing roasted coffee primarily in the northeastern United States.

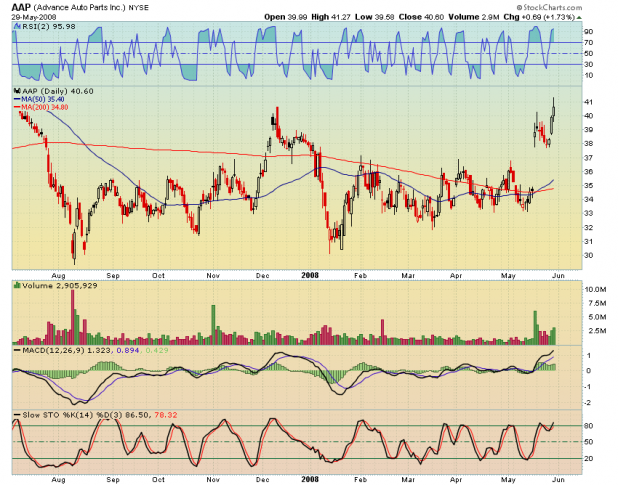
[[AAP]] Advance Auto Parts, Inc. operates as a specialty retailer of automotive parts, accessories, and maintenance items for do-it-yourself and do-it-for-me customers in the automotive aftermarket industry.

Comments »

Buying Breakouts vs. Pullbacks

Possibly the best reason not to lose all your money in your first few years of trading is that the time spent practicing (and hopefully not blowing up your account)  allows you to develop a style or strategy that suits your personality and lifestyle.

I used to be a buyer of breakouts. I followed William O’Neil. I bought strength. Weakness was bought by morons who did not understand the power of the technical breakout. I traded this way for  several years, and was profitable, trouncing the indexes. However, I discovered that buying breakouts make me uncomfortable. There are two reasons for this. The first reason is my tendency to want to anticipate the breakout, buying early, often got me stuck in a trade going nowhere. The second reason is that after the stock would breakout, it would suddenly seem expensive to me, and I developed fears of constantly top-ticking my entries.

Eventually, my psychology got the better of me, and I was buying strength, buying breakouts, but scared of top-ticking the trade. Therefore, on any signs of a pullback, I would inevitably sell at the very bottom. The realization of this developing problem hit me around the time I started wanting to develop mechanical systems to trade.

Anyway, I decided to make a concious effort to begin buying pullbacks, especially those that come just after a breakout, like this setup I posted last night: Russian ETF: Nice Entry Setup. Incidentally, I did buy some RSX on the open.

It has taken me about a year to be able to buy pullbacks comfortably. In order to get to this point, I have had to develop a trust of several conditions that must be present for me to buy.

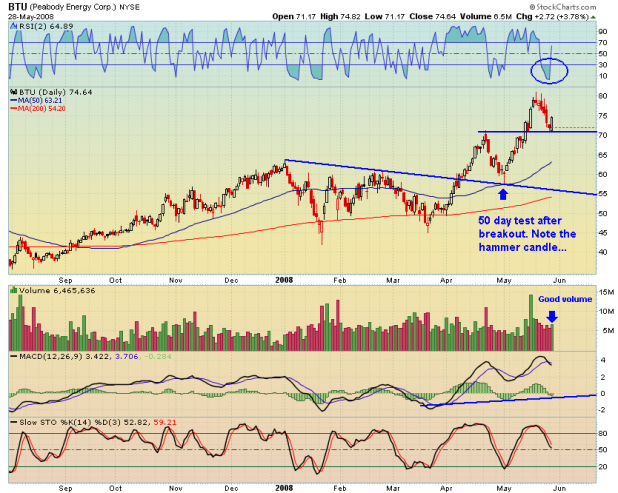
Like many traders, I missed the breakout in coal stocks, and watched in disbelief as they soared. However, BTU has offered a couple of entries, since the breakout. On the chart above, BTU broke out, and then made a perfect pullback to the 50 day average and a long term support line. That is one of my conditions; before I buy a pullback, the stock must bounce at an obvious area of support. It should be obvious, as you want other traders seeing the same thing, piling in with you. Notice too that RSI(2) was nearing oversold, which is a second condition.

Unfortunately, I missed the first setup in BTU. I’ve been watching for a second chance, and it came on Friday, as BTU pulled back sharply, nearing the area of a previous pivot point. RSI(2) was extremely oversold. I started a small position, and then doubled it on Tuesday, when BTU was able to hold just above its 20 day moving average. This was a money setup, and the trade has paid off today.

My three conditions for buying a pullback in a stock that has recently broken out:

1. Pullback to support, trendline or pivot point   

2. Very oversold on whatever your favorite indicator is. Mine is RSI(2).

3. Pullback to a major moving average, such as the 20, 50, or 200 day. Anything less than the 20 is not enough for me.

Now, I no longer anticipate the breakout and buy early, and I do not stress if I miss the breakout. I have found that these adaptations have made my trading more relaxing and comfortable. Time will tell if I can still turn large profits buying the pullback instead of the breakout. 


Comments »

The Daily Breakout: Early Wednesday Edition

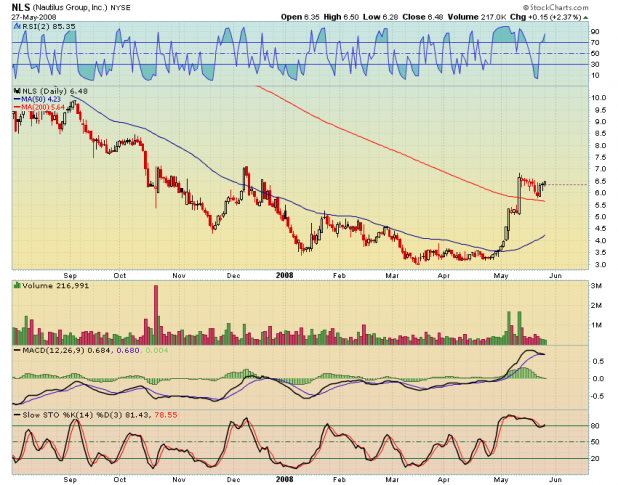
NLS: Nautilus, Inc. designs, develops, manufactures, and markets fitness products in the United States, the United Kingdom, Switzerland, Germany, and China.

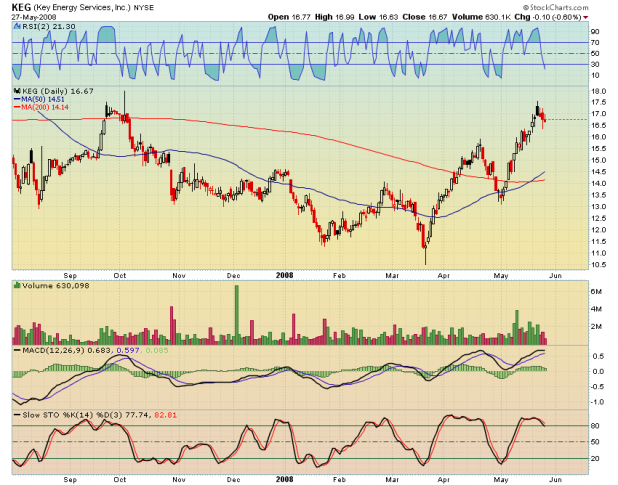
KEG: Key Energy Services, Inc., together with its subsidiaries, operates as an onshore, rig-based well servicing contractor in the United States and internationally.

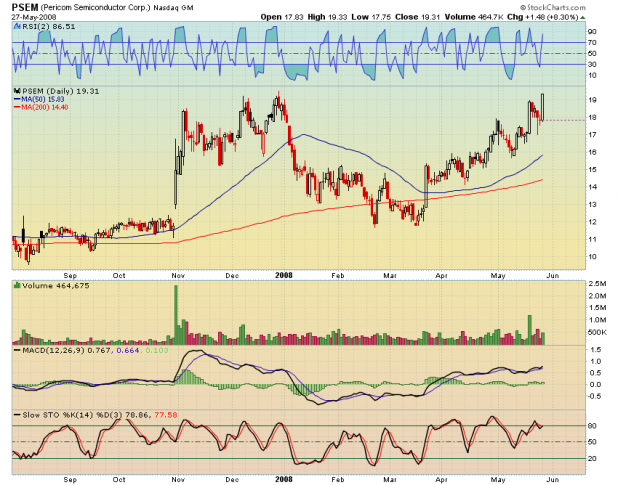
PSEM: Pericom Semiconductor Corporation engages in the design, development, and marketing of integrated circuits (ICs) and frequency control products (FCPs) used in advanced electronic systems.

Comments »

Russian ETF: Nice Entry Setup

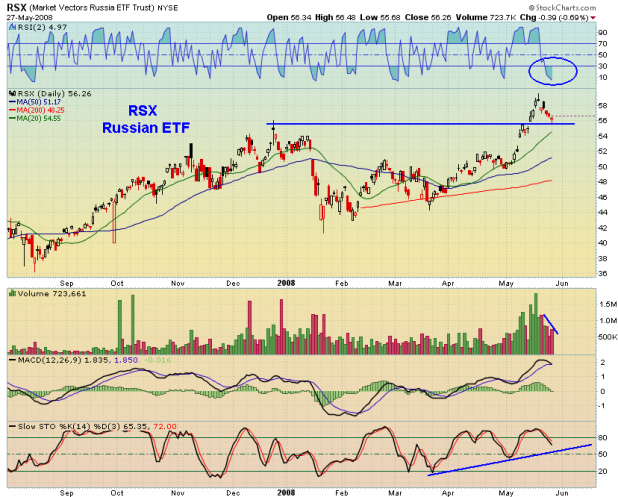
This is one of my favorite setups. I would rather play these than try and time/anticipate the breakout.

Notice the pivot point support, the low RSI(2), and today’s candlestick. It does not get much better than this.

Oddly, Stockcharts has started auto-printing that little dotted line, the one right above today’s candle. I wish someone would tell them to stop.

Comments »

Position Update: Exide Technologies

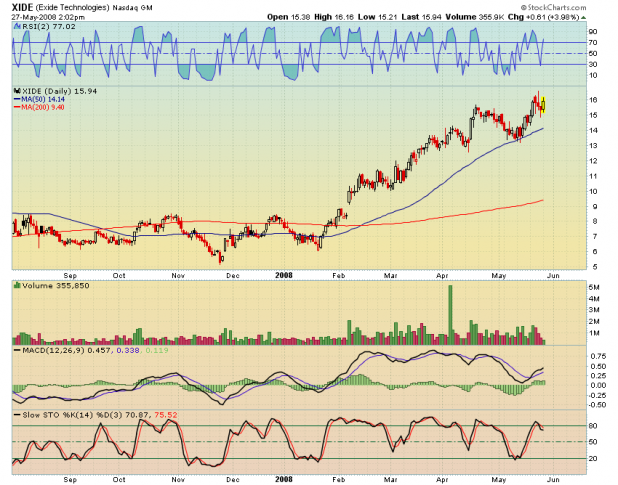
Exide Technologies broke out from a long base in February. The stock then doubled, before pulling back to the 50 day average. I started a small position in the company after the successful test of the 50 day and added more shares last Friday on the pullback, in my discretionary account.

Being primarily a technical analyst, take what is coming next with a grain of salt. I’ve been trying to figure out what the catalyst is for the huge run, besides the technical breakout. The most that I can find on a fundamental level is that it appears the company is close to swinging back to profitability, in recent quarters.

Also, with fuel and alternative energy plays being en vogue, I think that a battery maker, especially one that provides batteries for hybrid vehicles, may be attractive here. And to help things along, they just landed a major deal to supply Bosch branded batteries to Pep Boys.

I will keep my stops on this one below $14.00, but I’m also watching to see if the 20 day moving average can stay above the 50 day.

Comments »

System Quest: Implementing RSI(2) Strategy

I determined some time ago that I would eventually like to make the switch from discretionary trading to mechancial system trading.

Here are some previous posts from my old blog, over a year old, where I work through Tharp’s questions. I have listed his book in the iBC library under my picks. If you are considering system development, or are early on in the process, they might make interesting reads.

Setting My Objectives Part 1: Self Assessment

Part 2: Defining My Objectives

Part 3: Defining My Objectives

Anyway, I’m excited because I’ve found a system that fits my objectives. Of course, this is the strategy that uses RSI(2) to enter and exit long positions in the ultralong and ultrashort ETFs.

BHH over at IBD Index has been doing some great work, and has helped to take this idea from its infancy into a mature system. Dogwood has also made some great contributions. I will be tracking all the trades associated with this system on Covestor, and have put up a widget on the blog so that anyone can see at anytime how the system is working.

I’m putting this information all into one post so that when I receive questions I can refer readers to one place for answers.

What Is the System?

The system creates a long entry into one or more ultralong or ultrashort ETFs when their RSI(2) closes beneath 10. The system triggers an exit from the ETF when RSI(2) closes above 80. The buy or sell is made the morning after the signal is generated. I am currently using only the ETFs which average at least 100K shares traded per day.

There has been a good deal of tesing concerning stop losses, and it seems that the minimum stop should be near 12%, although a looser stop may work well for traders with a higher threshold for pain. If one can stomach the drawdowns, maybe a stop is not necessary at all. That is not a recommendation, just an observation. I have also been testing time stops, and have found that they decrease net profits without a corresponding decrease in the drawdowns.

BHH has also added another condition, and that is that the ETF must be trading above its 50 day moving average. You can check the results of the strategy with that condition applied here: More RSI(2). I think you’ll find the results promising, to say the least. The use of a percentage stop, coupled with this condition, seem to have minimized the drawdowns produced during earlier testing. Right now, I am not using that condition, although I may switch over to using it, soon.

The system typically produces better than 70% winners. This number will change based on any stops or other conditions that are applied.

Possible flaws in the system are introduced by the fact that most of the ETFs have not been trading for even a full 2 years. In order to account for his, I tested the S&P, Dow Jones, and Nasdaq, for at least the past 20 years. The ratio of winners to losers was very similar to the ETFs, but the annual returns and net profits were not nearly as good. Regardless, the system was still profitable but did not beat the indexes. Part of this can be mitigated by the fact that you were only invested about 33% of the time.

The beauty of the system is when it is applied ETFs. The ETFs are leveraged 2x and offer the opportunity to be both long and short. This is why it should beat the indexes.

There is still work to be done on this system. When multiple signals are generated, which ETF should be chosen over another? Also, is the 50 day average the best average to use?

As these questions are answered, and as success is hopefully achieved, I will update this post with future results.

Comments »