Read Part 1 here: Volatility Based Allocation.
In Part 1 I examined the basic strategy as outlined in Empiritrage’s documentation. Using $SPY as a tradeable proxy for the S&P 500 total return index, the backtests of the strategy and other similar strategies were posted. Part 2 will take a look at how this strategy has worked with the 4 other asset classes, and will then run the strategy over 4 classes equally weighted.
My thoughts on the results from the backtests using $SPY were as follows:
The volatility-based allocation (VBA $SPY) was able to come close to the $SPY benchmark return while significantly lowering risk metrics.
- Exposure was reduced by roughly 60%
- Maximum System % Drawdown was reduced by 80%
- Sharpe Ratio more than doubled compared to the other strategies.
If the goal is to beat the S&P 500 and include some downside protection, the ROC(5,252) and MA(2,12) have accomplished it. But with increased CAGR comes increased risk. I do not think it is possible to separate the good from the bad, but the VBA strategy shows on $SPY that it is possible to keep most of the good and throw out most of the bad.
Now let’s look at how the VBA strategy performed with the 4 other asset classes: $EEM (Emerging Markets), $IYR (Dow Jones US Real Estate), $EFA (Developed, Non-US Markets), $IEF (7-10 Yr. Treasury Bonds). All tests were run from the first trade date through 1.15.13. No commission or slippage were included.
$EEM Emerging Markets
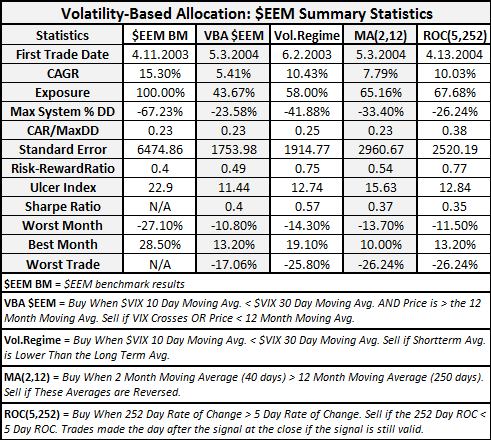
¹See the definition of the risk metrics used at the bottom of the post.
$EEM benchmark CAGR was very good at 15.30%. None of the applied strategies were able to come close to achieving the benchmark CAGR. The VBA strategy was the worst performer and still had a fairly steep maximum system drawdown. These results demonstrate a simple but important maxim: As CAGR increases, so will the maximum drawdown. That relationship is best measured by CAR/MaxDD. Note that the benchmark CAR/MaxDD was 0.23. This ratio was maintained consistently throughout all the strategies. Only the ROC(5,252) strategy was able to improve it.
$IYR Dow Jones US Real Estate
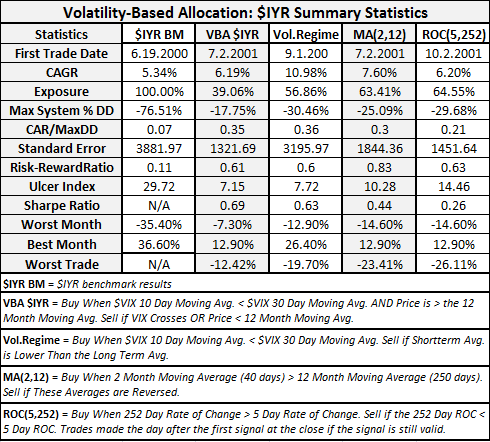
All of the strategies were able to beat the benchmark CAGR for $IYR. The VBA strategy provided the 2nd highest CAR/MaxDD ratio and the highest Sharpe. The Volatility Regime strategy came in a close second.
$EFA Developed, Non-US Markets
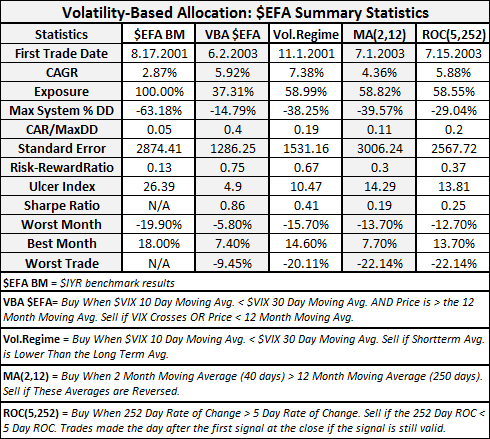
$EFA had a very disappointing benchmark CAGR. All of the strategies were able to beat it. VBA again acheived the highest CAR/MaxDD ratio and the highest Sharpe.
$IEF 7-10 Year Treasury Bonds
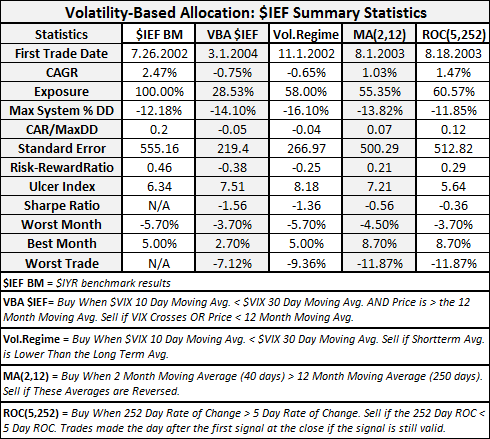
$IEF also had a low benchmark CAGR, but this should not be that shocking considering it is a bond ETF. None of the strategies were able to beat the benchmark, and both of the VBA strategies lost money.
I chose $IEF because I found it to be the closest tradeable proxy for the bond index used by Empiritrage. Perhaps it was not the best bond ETF to choose. Because both VBA strategies lost money using $IEF, I removed $IEF from the Core Equal Weight test.
To summarize: VBA yielded little benefit on $EEM, was the best performer for $IYR and $EFA, and lost money on $IEF.
Let’s examine how VBA performed as a strategy applied to a portfolio holding equal weights of each asset class.
Core 4 Equal Weight
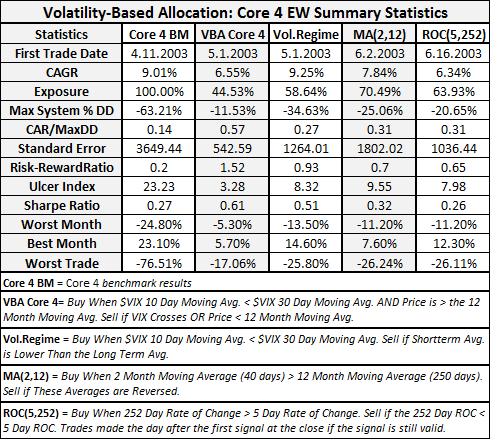
Again we see that VBA has beat the other strategies across all risk metrics including CAR/MaxDD and Sharpe.
The bottom line is that using VBA can allow for an asymmetrical relationship between risk and CAGR. This relationship between risk and CAGR is nothing new. One generally accepts greater risks for greater returns. In seeking to mitigate risk, VBA does punish CAGR, but not as much as it mitigates risk.
These studies represent merely a jumping off point for VBA and should not be assumed to be as good as it gets. In fact, one of the authors of the strategy is actively seeking testing and experimentation of this strategy. I believe that the strategy can be tweaked to increase CAGR while maintaining similar risk metrics.
My intuition tells me that tweaking the $VIX moving average lookback periods is a good place to start. I would also experiment with aligning the monthly re-balancing period with moving averages created with monthly rather than daily bars. Finally, I would want to add other asset classes and indices to the portfolio such as commodities and the Nasdaq.
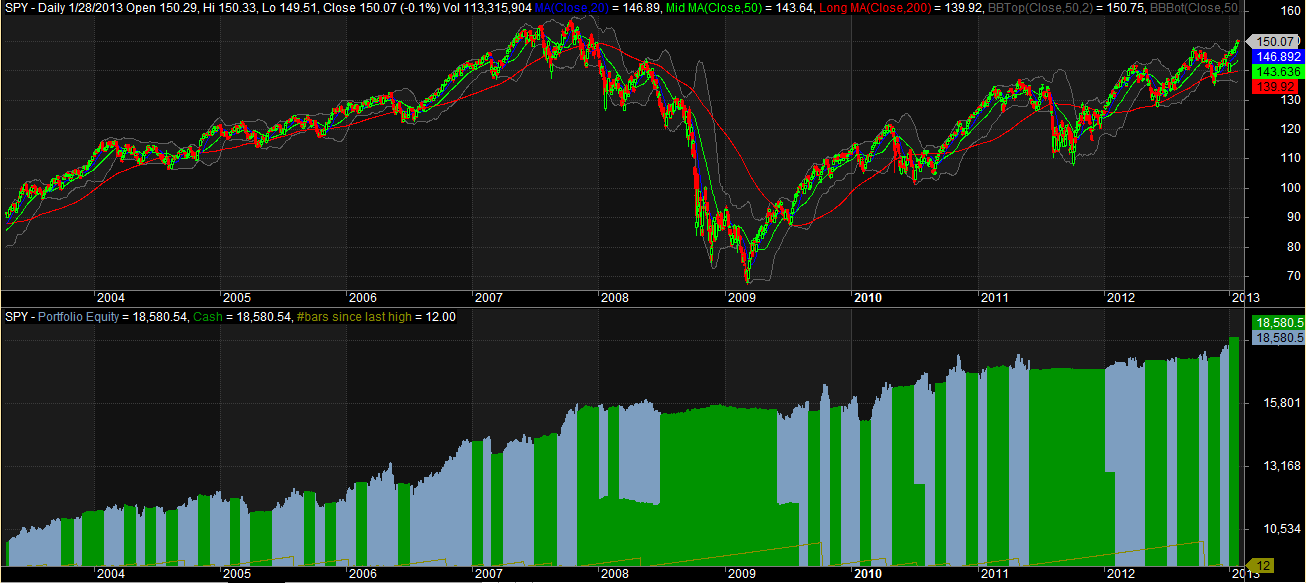
Bonus: Equity Curve for the VBA Core 4 Equal Weight Strategy
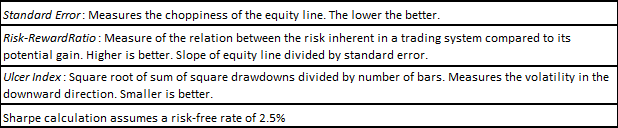
¹Risk Metric Definitions:
Comments »