iBankCoin
Joined Nov 11, 2007
1,458 Blog Posts

Forgive Me, For I Have Sinned

I have over-ridden one of my systems three times in two days. I really feel like I need to confess. This behavior cannot be tolerated.

As much as I try to ignore the noise, it is very hard.

The economy, employment, etc., are not the market. While I am extremely concerned about our country and the welfare (not that kind) of my fellow citizens, my angst should not be expressed through my trading.

When I want to express how concerned I am about our country and the economy, I think that my first reaction is to buy or sell something. In essence, I think that I’m taking a situation in which I find myself pretty much powerless to do anything to fix it, and through trading, I’m giving myself the illusion of doing something about it.

I hope that makes sense. For a systems trader, it is crucial to not over-ride the system. I’m trying to understand why I have over the last two days.

Comments »

Trade With The Trend While Trading Against It: Part Three

Parts One and Two established the framework and system to use for the study. Now it is time to get to the meat of the study: How can we combine elements of trend-trading to a system that often trades counter-trend?

First, what measure constitutes the trend? Deciding the best measure for the trend can be somewhat subjective; since many, many traders use the 50 day simple moving average, that is what will be used in this study.

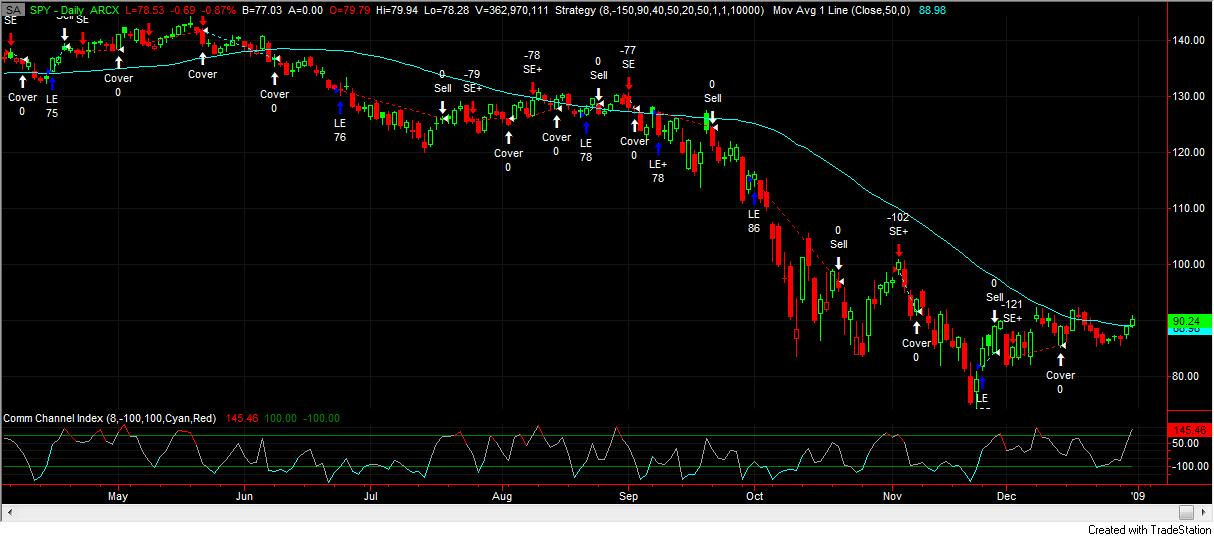
With the 50 day average as our trend indicator, the close must be monitored. If the close is above the 50 day average, we have a long bias. If the close is below the 50 day average, we have a short bias.

The final question then is how to capture the bias? While there are likely many ways, what will be proposed here is a combination of leverage and position-sizing. Thus, if the trade is with the trend (above the 50 day and going long, or below the 50 day and going short), as much as 2x leverage will be used. If the trade is against the trend (long and below the 50 day moving average or short and above the 50 day moving average), the position size will be decreased.

Finally, how will performance be measured to determine if the there are any improvements to the system?

Performance will be measured by 4 criteria: Net Profit, Largest Intraday Drawdown, Largest Trade Drawdown, and Average Drawdown. For each of these calculations, the drawdown figure will be divided into Net Profit to create a ratio.

For example: Net Profit = $10,000 and Largest Intraday Drawdown = $2,000. $10,000 / $2,000 = 5.0

As the ratio increases, the Net Profit is rising and the drawdowns are decreasing. Thus, the higher the ratio the better.

Using the system described in Part Two as the baseline, varying combinations of position-sizing and leverage will be used to trade with the trend while trading against it.

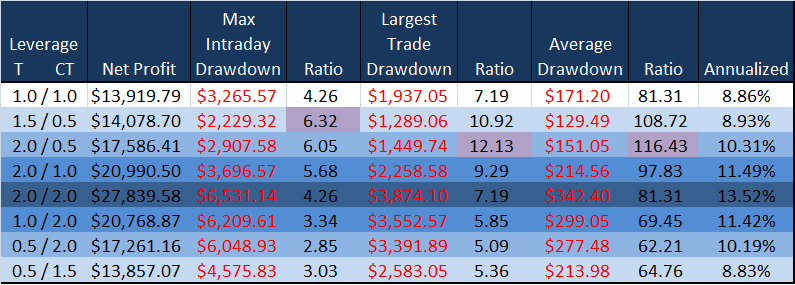
The graph above shows the results. The left most column shows the varying combinations of leverage and trend where T = trend and CT = counter-trend. We see on the first row the results of the baseline system where no leverage or position-sizing were used (T = 1.0 and CT = 1.0).

The second row shows leverage with the trend of 1.5x and a decrease in the position size when trading counter-trend of .5x. Assuming 10K per trade for the baseline system, with the trend a position of 15K is taken, while against the trend only 5K is used.

The third row shows 2x leverage with the trend (20K position) and .5x position against the trend (5K). This row shows the best drawdown ratios (in purple) for Largest Trade Drawdown and Average Drawdown. This version will have a position that is 4x larger with the trend than when trading against the trend.

Already it should be evident that Net Profit is increasing, due mainly to the leverage. However, the ratios show that drawdowns are decreasing. The 2nd row shows a ratio of 6.32 (in purple) which is the highest ratio of the study for max intraday drawdown. By simply using 1.5x leverage with the trend and cutting position-size in half against the trend, Net Profit increases while all drawdown measures decrease. In fact, for the 1.5 / 0.5 row, the largest intraday drawdown and max trade drawdown are decreased by roughly 1/3rd.

The row showing 2.0 / 2.0 is the baseline system using 2x leverage on all trades, regardless of the trend.

After the 2.0 / 2.0 row, the leverage and position-sizing are switched so that now the system is using leverage against the trend and decreasing position size with the trend. Note that Net Profit stays very close while the drawdowns increase (causing a decrease in the ratios).

I believe that the last three rows prove that leveraging with the trend makes up for the lost gains from taking smaller position sizes, while smaller position sizes when trading against the trend improves the drawdown characteristics of the system.

Summary

Beauty is in the eye of the beholder…I like the 2.0 / 1.0 version as net profit is improved by 33% over the baseline system while the drawdown ratios improve 25%, 22%, and 17% respectively.

If one is satisfied with the baseline system and just wants to improve the drawdown characteristics, then the 1.5 / 0.5 version might be appropriate.

Avenues for future research could include using the distance of the close from the trend to calculate more advanced position-sizing / leveraging algorithms. Perhaps the slope of the trend indicator could also guide position-sizing / leveraging.

In Terms of Real Life…

The baseline system gave a long entry signal for Thursday’s (February 19th) open. Had the 1.5 /0.5 version been used, only a HALF position would have been purchased. Based on the recent market action, I would personally feel better about sitting on a half long position rather than a full long position going into Monday.

Comments »

Trade With The Trend While Trading Against It: Part Two

Now I will present the system to be used for the study that was described in Part One.

The System

The system uses an entry and exit signal generated from the CCI (Commodity Channel Index) indicator. For more information on the CCI, here is a helpful explanation: Commodity Channel Index.

BZBTrader and MarketSci have written about systems using the CCI. Both blogs titles are hot-linked to open directly to the posts demonstrating CCI systems.

As systems go, this is not one of my favorites, although it is profitable. I have not spent an inordinate amount of time developing my version of it. As the system makes money from being contrarian, it will work well for this study.

The Entry

All entry and exit signals are based on the end-of-day CCI(8) reading and will be triggered on the next market open.

A Buy signal is generated when CCI(8) crosses above -150 from below. This means that the system is buying weakness.

A Sell Short signal is generated when CCI(8) crosses below 90 from above. This indicates that the system is shorting on strength.

The Exit

An exit signal for any long position is generated when CCI(8) is rising and crosses above 40 from below, meaning the system is selling the long position into strength.

A Buy to Cover signal for any short position is generated when CCI(8) falls to below 50, meaning the system is covering into weakness.

System Specifics and Results

Period Tested: 10 years back ending on 12/31/2008 using the SPY.

10,000 per trade with no compounding of gains. Gains are purposely not compounded during back testing. It will be best to cover the rationale for not compounding gains during proof-of-concept testing in a future post.

Commissions of .01/share are included. I have not included any returns generated from the cash available when the system is out of the market (It is only in the market about 50% of the time).

Some Chart Porn

The equity curve is fairly smooth, except for the end of 2008 (This will be improved in Part Three).

The weekly drawdowns are not awful, but will also be improved in Part Three.

The above graph shows the recent trades and the CCI indicator in the lower pane. Also plotted is the 50 day moving average. The 50 day moving average will be the intermediate trend indicator. Note the long entry (LE) that was made on 10/1/08. The CCI system entered long in oversold conditions, and then the market cratered, getting more and more oversold. This particular stretch of market history caused a lot of angst for traders of mean-reversion systems.

Summary

Presented above is a mean-reversion (contrarian) system. As such, it seeks to buy when the market is going down and sell when it is going up. Unfortunately, as shown in the October trade, the system will often take a trade against the intermediate trend (as shown by the declining 50 day moving average). Occasionally these trades against the trend will result in large drawdowns.

Now that the system has been presented, Part Three will use the intermediate trend (50 day average) to determine position-sizing and leverage. The final result will be the proof-of-concept of a “best of both worlds” system with decreased drawdowns and increased profits.

Comments »

Big Bamboo Closes Two Profitable Trades

The closed trade prices are highlighted in a pleasing green hue. The system exited DXD on Tuesday’s open and sold SKF on today’s open.

The system really needed these winning trades. They were quick with very little drawdown, just like the Big Bamboo of September and October.

Win% climbed to 50% and Return Since Inception increased to 15.54%.

No New Entry Signals for Thursday

Comments »

Trade With The Trend While Trading Against It: Part 1

Traders who have not added to their arsenal some form of mean-reversion trading methodology really missed a banner year (2008) for that style of trading. Traders considering making the transition from momentum and breakout strategies to mean-reversion methodologies may have a difficult time as the shift requires them to be contrarian. Taking a contrarian approach requires a transition to an alternate mindset as the trader has become psychologically accustomed to trading with the trend.

Even once this shift to contrarian mode is accomplished in the trader’s mind, taking a contrarian approach can still hit his wallet. For example, most mean-reversion approaches would have had the trader positioned long during September 2008, as the world was staring headlong at an economic maelstrom. A contrarian trader would have been positioned for a short term bounce within the context of a longer downtrend.

The best of both worlds then, or trading with the trend while trading against it, would be a system that benefits from the regular short-term swings of a mean-reverting market but is not punished by severe drawdowns when the market does not revert (swing) as quickly or as completely as the trade requires.

In Part 2 I will show a system that is contrarian and trades against the short-term trend. The system will use position-sizing and leverage to accentuate returns when trading with the intermediate trend. Similarly, position-sizing will be used to decrease drawdowns when trading against the intermediate trend. What will then be presented is a system that attempts to capture the best of both worlds: Mean-reverting, yet leveraged with the trend.

Comments »

Big Bamboo Updated with Latest Trades

On Friday’s open the system bought SKF and DXD. The trades closed in the money. DXD has met the exit criteria of RSI(2) > 80 and so it will be sold on Tuesday’s open. SKF has an RSI(2) still in the 70s so it will be held Tuesday.

The spreadsheet shows a win percentage of 44%. This is much lower than the backtested 76.71% win rate over 73 trades since 12/31/2007. I can reason that there are two explanations for this. The first explanation is that the Big Bamboo is losing / has lost its edge. While this is certainly possible, I doubt it. When I test the entry (proprietary) across other markets and combine it with different exit criteria, the edge is very strong. As RSI(2) is still very effective for timing both entries and exits, I do not think the exit criteria is weakening either.

The second explanation is that the system is at the bottom of the inevitable performance valley. If it is going to trade out of this valley and to another peak, the win percentage will climb back to meet or exceed historical expectations. I find it likely that the system is going to rip off a half-dozen or so winning trades in a row, bringing the win percentage up with it.

For anyone not familiar with this system or the series of posts that accompanies it, I am not recommending trading the system, although I have, from time to time, traded the signals in my personal account. Instead the posts are to help non-system traders understand how trading a system presents its own psychological challenges and does not necessarily “remove emotions from trading” as some might like to believe.

Back in December when the Big Bamboo was in the midst of a losing streak, some were wanting to proclaim the death of the system. This is the same mistake that some system traders make, which is to quit trading the system during the deepest part of a drawdown.  My experience leads me to believe that systems will recover some of their drawdowns, even if they are beginning to fail.

It will be fun to see what happens going forward.

Comments »