iBankCoin
Home / Woodshedder (page 30)

Woodshedder

Fidelity Sector Rotational System Will Go To 66% Cash

On Friday, October 12th, the S&P 500 $SPX closed beneath its 50 day moving average. This causes the Fidelity Sector Rotational System to sell any open positions that have been held for more than 30 days, at the next close.

FSTCX (Telecommunications) and FBMPX (Multimedia) will be sold at tomorrow’s close. FSAGX (Gold) will remain open.

When $SPX regains its 50 day average, the system will purchase the top 2 Fidelity funds and will be 100% invested.

The system has a net profit year-to-date of 10.24%. $SPY has a gain year-to-date of 12.07%

Comments »

Correction or Consolidation?

Yesterday was the biggest down day for the Dow Jones since July, and the 4th down day in a row for the S&P 500. Both the Dow Jones and the S&P 500 are sitting just above their 50 day moving averages while QQQ sliced beneath 50 day on Tuesday. The S&P 500 made a slightly lower low meaning that the trend has changed.

Earlier this year the S&P 500 began correcting in early April and found a bottom on the first of June. This correction eroded more than 9.5% from the index. Should we expect another 10% decline? Or is a pullback of 5% more likely?

Average Frequency of Market Corrections

  •  5%: 3 Times Per Year
  • 10%: Once Per Year
  • 20%: Once Every 3.5 Years

Source: Capital Research and Management Company. Period: 1900-2010.

Since we’ve already seen a correction (or near correction) this year of ~10%,  should we instead be looking for a more shallow pullback? I think so. The current pullback has shaved almost 3% from the S&P 500. We can shave another 2% or more and still be watching completely normal market action. In fact, due to the low volatility of 2012, I’m not sure we’ve seen 3 instances of a 5% pullback yet this year.

My indicators are pointing towards an immediate bounce, but I do not think the bounce will be sustained. Instead, I’m looking for another lower low and some consolidation around the 50 day moving average. I do not think we will see much more than 2-3% downside from Wednesday’s close.

Comments »

High Tight Flags for Tuesday

$ZLC is a superb HTF. Other than that, there is not a whole lot going on with the HTFs.

The last time $ZLC was identified in the HTF screen was September 16th. That was a great buy point…


Comments »

Dip Buyer’s Dilemma: Attempting to Filter Out Waterfall Trades With a Bollinger Band

Introductory Post: Dip Buyer’s Dilemma: Sometimes You Buy the Waterfall

2nd post: Dip Buyer’s Dilemma: Identifying the Waterfall Trades to be Filtered

I’ll assume the first two posts have been read and cut straight to the chase.

I’ve added a lower Bollinger Band (50,2) to the system and changed the rules so that the system will not buy $SPY even when the decliners indicator is greater than 80.

The test is going to run from 1.1.2007 to 10.4.2012. The first graph is of baseline system performance where $SPY is bought at the close when the decliners indicator is greater than 80 and sold at the close 10 days later. The baseline performance includes the waterfall trades as identified here. The second graph shows performance after the Bollinger Band filter has been added.


As predicted, the Bollinger Band filter reduces performance. However, it does lower the max trade % drawdown and the max system % drawdown. It also reduces the total number of trades by 25 which lowers exposure significantly.

But does the filter keep the system out of the waterfall trades? Let’s look. In the interest of transparency, I’ve included all the trades made. The list is long. The trades highlighted in yellow were on the original waterfall list and were NOT filtered out.

Below is the original waterfall list:

Using the lower Bollinger Band filter eliminated 7 of the 12 waterfall trades.  However, a quick scan of the trade list shows that the system added other waterfall trades. Just scan the % Change column and look for the large losing trades.

While adding the filter did eliminate more than 50% of the waterfall trades, it hurt performance overall (as predicted). To see how much the filter hurt the system, just compare the two equity curves.

With Bollinger Band Filter

Without Bollinger Band Filter

In the next post I’ll apply another popular filter.

To be continued…

Comments »

High Tight Flags for Wednesday

Not much going on in the market right now. We are seeing some selling pressure but are holding above the recent low made 4 days ago. Until we see a lower low, I don’t see much to get excited about.

Recent action has not been good for the development of High Tight Flags. There are currently only two.

Comments »

Dip Buyer’s Dilemma: Identifying the Waterfall Trades to be Filtered

Be sure to take a look at the introductory post here: Dip Buyer’s Dilemma: Sometimes You Buy the Waterfall

The system I am applying the filter to is a simple breadth system which uses the percent rank of the number of declining issues to generate a number between 0 and 100. When the number is greater than 80, it buys $SPY. To keep things simple, each trade has a time exit of 10 days. All buys and sells are made on the close of the day of the buy/sell signal.

Here is how the system has performed over the entire $SPY history:

The annual return is low. If we test from 1.1.2002 – 9.30.2012 the annual return is 9.52%. The equity curve below shows when the system really started working.

The system has performed well over the last decade.

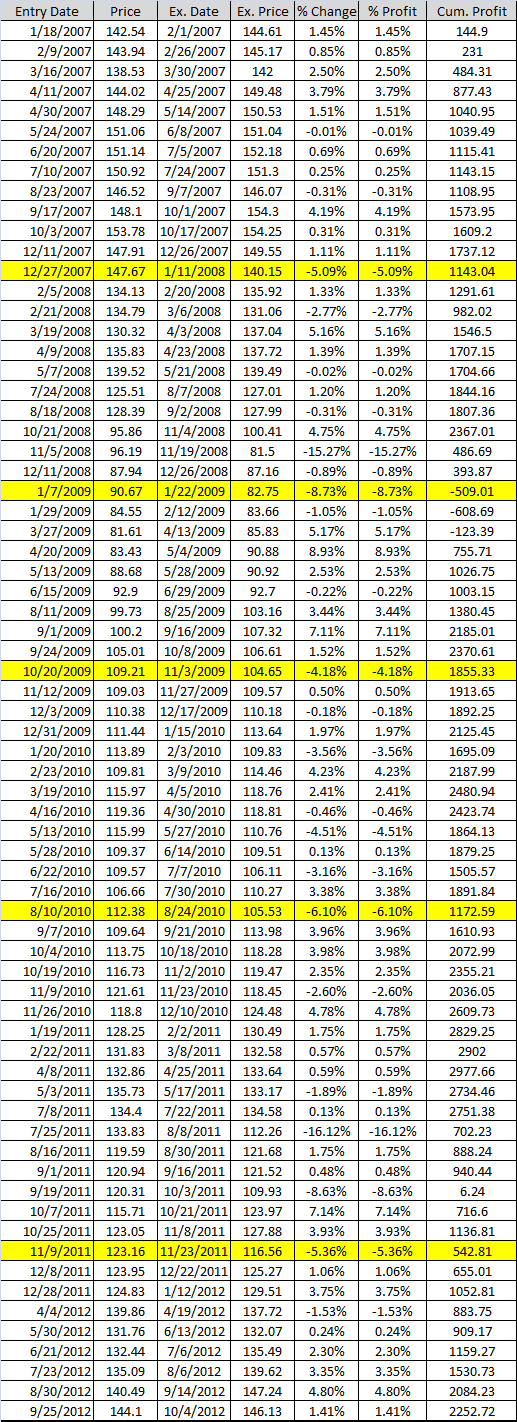
So that is the system. The question is, can waterfall trades be filtered out? In order to answer that we need some dates for trades made during waterfall type declines. I am going to define all trades losing over 4% or more to be during a waterfall type decline. This is rather unscientific as some of these losses are during classic waterfall type events while others are not, but I needed a threshold and 4% is it.

What we want to see after the filters are applied are that these trades are filtered out. To avoid being overwhelmed by information, I’m going to start the system at 1.1.2007 and not consider all $SPY history.

The list above is not a definitive list of large market pullbacks or corrections since 2007, only the dates of trades made by the system that lost 4% or more.

I want to emphasize that the system avoided some waterfall events simply because of the nature of the system. However, the system did catch some of the classic Armageddon trades during the 2008-2009 bear market, and they are easily visible in the equity curve.

The next post will show the results of adding the first filter, which will be a lower Bollinger Band using a 50 day mean and a width of 2 standard deviations. I honestly have no idea if it will filter out some of the waterfall trades, but it is one of my favorite abnormal market type filters. I am 100% certain though that even if it does filter out some of the trades, overall performance will be worse.

To be continued…

Comments »

Dip Buyer’s Dilemma: Sometimes You Buy the Waterfall

In a recent post, friend of the blog vimal wrote this:

I like the indicators you use here. I have one query. How would you have utilised this in July and august 2011 as the market decline then was waterfall like. Buying for a potential bounce was tricky for me personally.

There is a simple answer to this question. Sometimes one buys the waterfall, but most of the time one buys a normal dip. In other words, if the dip-buying strategy is sound, more will be won than lost, even when suffering through the occasional waterfall. Using filters in an attempt to eliminate buying waterfalls can sometimes reduce drawdowns but come with the expense of reduced profits. That point needs to be over-emphasized: Filters don’t always reduce drawdowns but they almost always reduce profits.

Let’s take a look at filtering in practice. We’ll apply a filter to the simple breadth system which elicited Vimal’s comment. While the system is triggered by extreme breadth readings, the essence of the system is that it buys SPY dips.

To be continued…


Comments »