Today, despite closing slightly lower, the S&P 500 closed for the 5th day above its upper Bollinger Band (50,2). I have written previously how closes above the the upper band are typically bullish and may signal an abnormal market. This evening we’ll examine what happens after 5 consecutive closes above upper Bollinger Band.
The Rules:
- Buy $SPX at the close after it has made X consecutive closes above its upper Bollinger Band
- Sell Y days later
- $SPX history starts in 1928
- No commissions or slippage included
The Results:
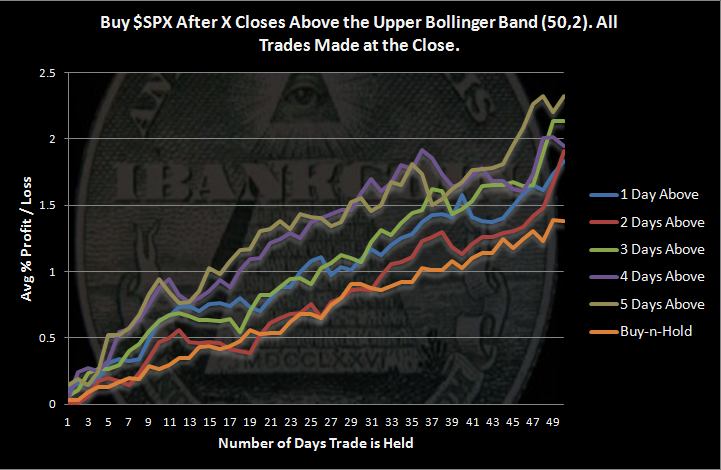
The results are more bullish than I expected, and they improve as the number of closes above the upper band increases.
- This setup was not nearly as rare as I had imagined.
- There were 126 occurrences of 5 closes above the upper band with 110 trades held the full 50 days.
- After 5 closes above the upper band, $SPX has closed higher 50 days later 67.27% of the time.
- Buy-n-Hold results are calculated by cutting $SPX history into 50 day segments and then averaging the segments.
The number of samples should be sufficient to lend reliability to the results, but I am honestly a little disappointed because I suspected the results would be either extremely bullish or extremely bearish. I was looking for some drama and didn’t find it. Instead, this study just presents another reason to lean bullish.


Interesting. Thanks wood
No problem. I really expected something more dramatic.
2nd’ed love these! Was waiting anxiously for this one
Wood, do these results look different if you only include data since 2010?
slim, there were only 6 instances of 5 closes above the upper band since 2000.
I don’t know how different they will look, but I will look at it at some point. If the results are interesting, I’ll post about it.
Thanks. I really enjoy these studies you do.
Wood – when you run these studies, do you look for areas of max pos/negative effect? IOW, instead of just looking at 50 days, do you look for where you get say 80% up and find that you see this about 15 days out? Does this even make sense?
I don’t really, but I could. It would be easy to discern the max pos/negative effect just looking at the posted graph. For example, around 10 and 35 days out looks good. I would bet within a day or so of those days would be a win % of more than 70%. Does that make sense?
Nice work, thanks. I wonder if there is a more definitive trend based on the month or season of the trigger.
Hmmm. I think I get what you are saying. I do think it is odd to see this setup, which is bullish, in the middle of “Sell in May” seasonality.