I have written many posts about abnormal markets. On Friday, $SPY met a basic criteria for being abnormal with a bias to the upside.
There are times to short and there are times sit on our hands. How do we determine when to short and when to sit? One method I like is to use the upper Bollinger Band (50,2) as an abnormal market filter. I have found through backtesting that a close above the upper BB signals a market that may be entering or continuing a sustained uptrend. In other words, it is a market that is less-likely to revert to the mean and more likely to trend. This may be counter-intuitive as we typically view a market that has been sharply rising as one that is due for a correction, or at the very least, a pullback. What I have found after a close above the upper Bollinger Band is that instead of a sharp pullback or correction, we see some consolidation and then a resume of the uptrend.
Let me demonstrate.
The Rules:
- Buy $SPY at the close if the close yesterday was NOT above the upper Bollinger Band AND the close today IS above the upper Bollinger Band (50,2).
- Sell $SPY at the close X days later.
- No commissions or slippage included.
- All $SPY history used.
The Results:
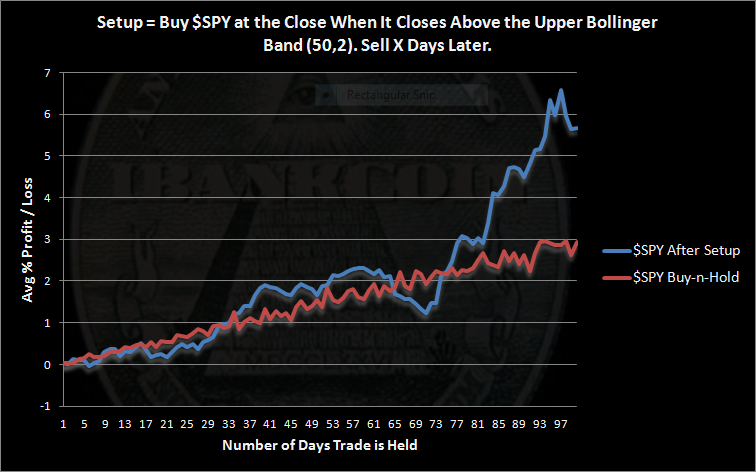
There were 123 occurrences of this setup with 27 being held for the full 100 days.
These results compare buying $SPY according to the rules above vs. buy and hold. To generate the buy and hold results and have them comparable, I split all of the $SPY history into 100 day segments and then averaged the segments.
The buy and hold results show the clear bias to the upside that has been prevalent over the past 20 years. The setup results show a market that has closed more than 2 standard deviations above the 50 day mean and still manages to climb almost 2 months later to close higher on average than buying and holding. After this setup, the market has tended to surge, and 100 days later has averaged a return of almost twice what we would expect with buying and holding.
And that is why this triggers the abnormal market filter. It is not a market that we want to aggressively short. We may also not want to be aggressively long. The results show we may have a few weeks to consider our positioning and bias.
The bottom line is that I am looking for the market to trend more than swing. These results suggest that the swings may be less predictable and the market may shrug off bad news as it climbs the wall of worry.


Really interesting. I recall the previous comments about an abnormal market – it just exploded upwards, didn’t it? Maybe from HFT, hedge funds, nervous retail investors? It was a great post, in any case.
Bruce Krasting has a post (http://brucekrasting.com/bernankes-legacy-problem/) about the Fed’s latest minutes, which many took to be an indication of early rate increases. But, several commenters thought the Fed did that just to head off a moonshot from the market, just like what you describe above. We still might see $4 copper and $110 oil.
I don’t think the Fed will do a damn thing except keep buying bonds. Thanks for the Krasting link!
How would you read this on the shorter time frame of the last 2 years in an exhaustion context?
http://mediacdn.disqus.com/uploads/mediaembed/images/411/9861/original.jpg
Hmm. Not sure. So I just re-ran the test from 1.1.2011 to 1.4.2013.
To try and capture shorter performance, I had the system sell after 10days, 25days, and then 50days. The results are as follows:
10day hold = avg. profit/loss of -0.16%. 3 Winners, 4 Losers.
25day hold = avg. profit/loss of -1.42%. 1 Winner, 5 Losers.
50day hold = avg. profit/loss of +1.48%. 3 Winners, 2 Losers.
I’d say over the past two years it has led to some exhaustion over the next month.
Is that what you are seeing as well?
The key point for me though is while the market may look over extended, historically it hasn’t fallen apart enough after this type of setup to warrant aggressive shorting.
Instead of using the negatively charged word “exhaustion”, I should have more accurately said “in a triangulating, rising wedge environment”.
The market looks tired to me when looking at the short to intermediate term (I’ve got another chart idea to illustrate that I’ll post once I’ve put it together), but I’m starting to think there is more longer term strength than I have been giving credit, something like the marathon runner who hits the runner’s wall but then gets a second wind. Your shorter term re-run of the test is more confirming evidence of possible short term weakness before we get a clear resumption of the longer term uptrend.
Very nice signal indicator BTW. While it may not exactly identify either trading range extremes or an early new trend breakout, it certainly helps to clearly show where either one or the other will probably take place. I’ve been working on a top/bottom spotter group of indicators, and I’m going to add the Bollinger 50,2 to the group!
Here’s a link to further comments (that also complement my latest post) and that chart I mentioned.
http://highrevsopenhouse.blogspot.com/2013/01/wide-range-days-and-violent-reversals.html#comment-758808304