Last week, volume on SPY surged to 175% greater than the 50 day average volume. Does this surge in volume hint that a tradeable bottom is near?
On Wednesday, June 15th, SPY volume surged to more than 175% of the 50 day average and made a new 50 day low. On Thursday, volume again surged. When looking for bottoms, it helps to see capitulation. Volume surges coupled with new lows suggest that capitulation may be occurring.
The wild card, and the major caveat of any current SPY study is that it continues to close beneath its bottom Bollinger Band. Since the bottom band marks 2 standard deviations beneath SPY’s 50 day average, multiple closes beneath it signals that the market is abnormal. An abnormal market can stay abnormal longer than we would like. I have written previously about abnormal markets here. We really need multiple closes above the bottom band before this abnormality is removed. Once this happens, bottom-calling makes more sense, in my opinion.
Anyway, lets look at what the volume surge suggests.
The Rules:
- When volume surges to more than 175% of the 50 day average volume, buy SPY at the close
- Sell X days later
- No commissions or slippage included
- All SPY history used
The Results:
Summary of Results:
I added two other variables in order to more accurately model recent market action.
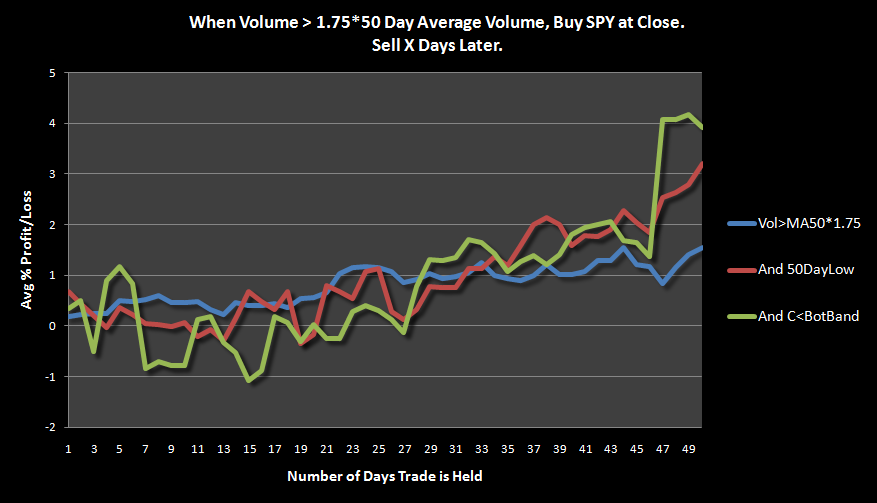
- The blue line is the basic setup where volume surges to 175% of the 50 day average volume
- The red line adds the factor of the new 50 day low
- The green line uses the other factors and adds the requirement of the last close beneath the lower Bollinger Band (50,2)
Sample sizes for these studies were acceptable with 271 occurrences of the basic setup (58 trades if the trade is held the full 50 days), and 59 occurrences of the added factor of the 50 day low (29 trades if the trade is held the full 50 days). Adding the final factor of the close beneath the bottom Bollinger Band reduces the number of occurrences to only 24 with only 14 trades if the trade is held the full 50 days.
Bottom Line: As noted above, SPY has got to quit closing below the bottom Bollinger Band. Until it doesn’t, we should expect that it will continue. If we ignore the additional factor of the close beneath the bottom band, it appears that the market may be bottoming. The red line is suggesting some consolidation over the next month. After about 25 days, consolidation has ended and over the next 25 days, SPY has climbed 3% on average.


Man Mr. Shedder the caliber of your studies makes me jealous. I just wanted to drop you line to commend you and thank you dearly because you can produce the type of studies that I can only dream about.
Wood, why do you prefer the 50,2 over the 20,2 for bb’s? Better longer-term view?
Chivo, some time go I was doing studies, trying to figure out how best to know when a market reaches an abnormal state. 50,2 worked very well for this. However, to get even better readings, the width should be adjusted, for example, using 1.75 on the upper band and 2.25 on the lower band. But yes, a 50 period lookback does give a better long term view and imo, a better long term view gives a more clear picture on what is or is not abnormal.
Hey Woodshedder, I don’t understand the bit about holding for 50 days v. not holding for 50 days — e.g. “271 occurrences of the basic setup (58 trades if the trade is held the full 50 days)” I thought you always held for 50 days?
With the green line, do you know if there’s an outlier/extreme value effect on the mean? Could be there’s just a few really bad cases that bring down the average return. The spread of returns could be potentially important. Maybe a box and whisker plot?
Data, the test is taking all returns for the 1st day, and averaging them. Then taking all returns for holding 2 days, and averaging them, etc. until it has held all trades for 50 days. Imagine if a signal is given, and the trade is taken, and held for 50 days. During that 50 day period, there might be more of the same signals, but they would not be able to be traded since the system is already in a trade. So there might be 1 trade made during the 50 days but 3 occurrences of the signal. Therefore, the closer each test gets to 50 days, the fewer trades it will have used to calculate the average return. Let me know if this is confusing or if I have explained it well enough.
With the green line, because there was so few samples, I strongly suspect there is an outlier present, but I did not take the time to look. I can, easily enough, I just didn’t 😉 I’ll look into a box and whisker plot.
Woodshedder – Ah, I gotcha with the 50 day holding bit. One thing that seems strange to me is that the 50 day trades and 1 day trades are triggered by a slightly different set of signals. The 50 day trades would almost always be triggered when the indicators FIRST go into the red. However, the 1 day trades can trigger when the indicators turn red and then every subsequent time they go green and turn red again. I would think to compare apples to apples, you would want to restrict the 1 day trades to be triggered only by the smaller subset of signals used for the 50 day trades.
So what I’m kind of imagining when I look at the chart is “if I buy on the first volume surge of the correction (i.e. on the June 15th’s), how well off will I be 1 day after, 2 days after, 3 days, and so on”. So the graph would show the average return of the 50 day trades at day 1, 2, 3, and so forth. That would kind of show how the correction “plays out.”
Hey Wood,
Nice study. Also curious how some more defensive plays would have faired over these time periods. Maybe something along the lines of XLU, AGG, FXF. Of course, I do not know how far these ETFs go back in relation to SPY off the top of my head.
Hope all is well and best wishes!
Wood,
Is there a trick to downloading fundamental data for AmiBroker?
Using “fundamental basic or extra” through AmiQuote did not work for me
I want to filter my auto analysis by sectors but the info doesn’t get downloaded
I could ask on their forums but I also wanted to say you’ve been nailing it out of the park with these lately.
Thanks
go2, I’ve never tried. I think the forum is your best bet.
Thanks for the props! They have been pretty accurate.