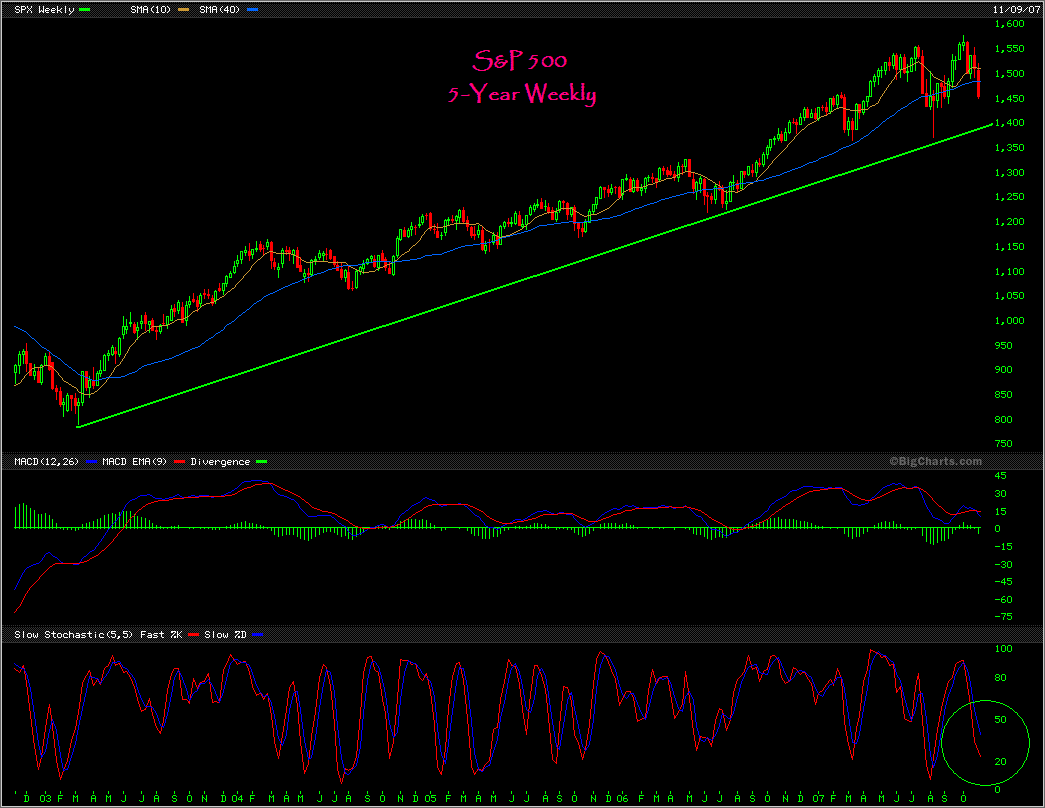
Note the volatility of the SPX during the last several months. The erratic nature of the pullbacks and upswings is certainly a change from the previous 4-years worth of trading. While volatility in and of itself does not necessarily portend a change of trend, it certainly highlights that there appears to be something different happening now. The stochastics are of particular interest here as they are not yet showing oversold.
Should the move down continue to the area of 1400, it would represent a correction of ~12% from the recent high.
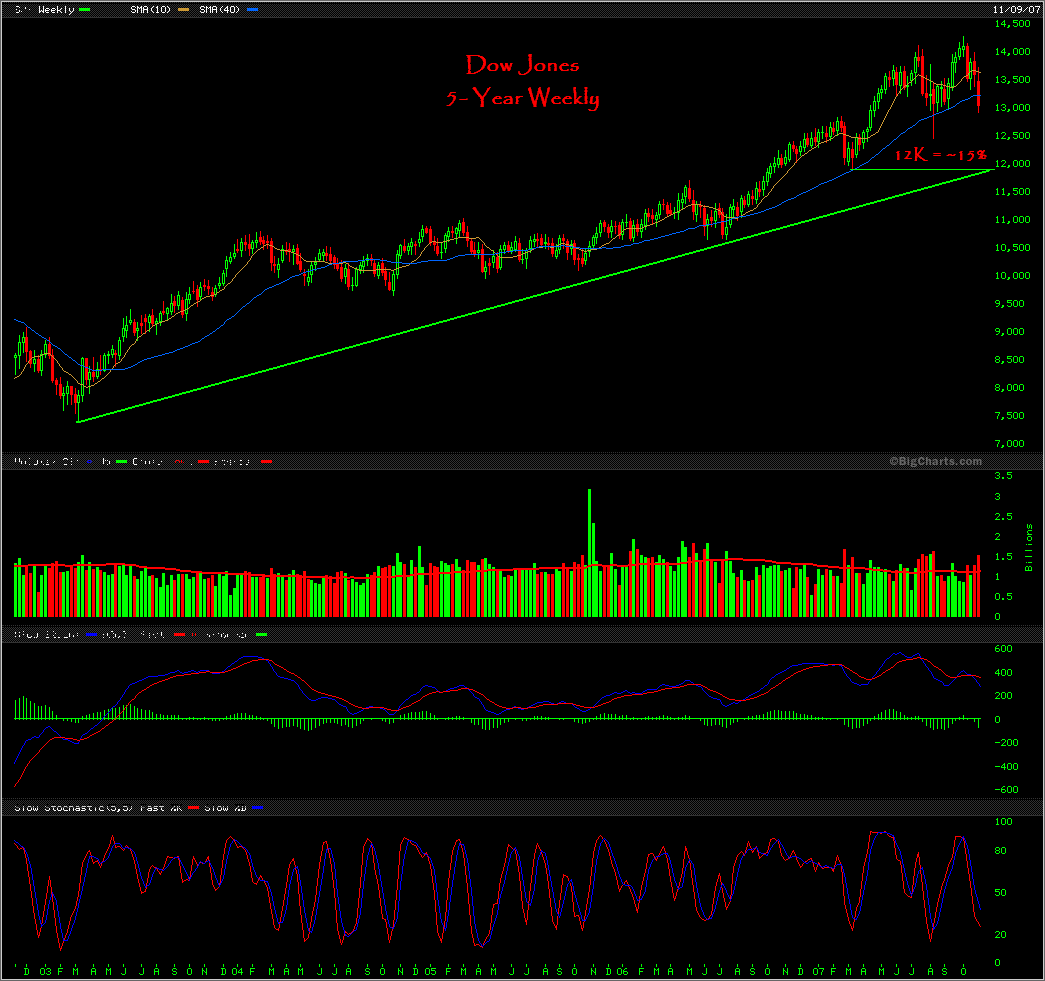
The last several months on the DJI have also been characterized by erratic, volatile weekly moves. Again, this is somewhat of a change from the orderly trading of the last 4 years. Here, the stochastics are close to oversold.
 A continued move down to 12,000 would give a correction of ~15% from the recent high.
I should note that I do intend to provide actionable ideas here. Right now, short just about anything and your trade will quickly be in the green. However, a bounce is inevitable. Once we get at least half an attempt at a bounce, it will be time to look at individual stocks. In the meantime, keep your list of the leveraged index ETFs handy in order to play either side of the relief rally.


“short just about anything and your trade will quickly be in the green” = Woodshedder bottom?
I love the fucktarded straight lines and shit on the charts.
Congrats on the new blogging “job!”
Thanks!
Bill, as the indexes are within spitting distance of the RSI(2)<2 buy signal, I'd say that my statement will certainly bring about the Woodshedder bottom. At least for a day or so.
Shed – what do you think of the MVIS chart turned upside down?
Juice, only a clown would turn a chart upside down.