Here are some charts are I put out last night. My goal here is to chart some more of the quiet stocks that don’t get much attention on the social stream. There is one exception and that is the ETF of the iShares Emerging Markets (EEM). The chart looks great and what you want to see in a risk-on environment. Below you will find the symbol with FinViz link and the notes that were put out with the chart:
1) EEM – like the flagging action here, like to see this in the risk markets

2) NTRS – regional financial, like the volume on this move up w/low volume pullback, earnings soon

3) FET – oil & gas name trading cheap xFwd #’s, holding & like the CwH retest here on recent downgrade

4) GPI – like the FA value w/10.3 days to cover, y’day action favorable on high volume w/follow thru today

5) KNX – broke the down TL on >avg volume, basing below resistance/200sma w/earnings coming

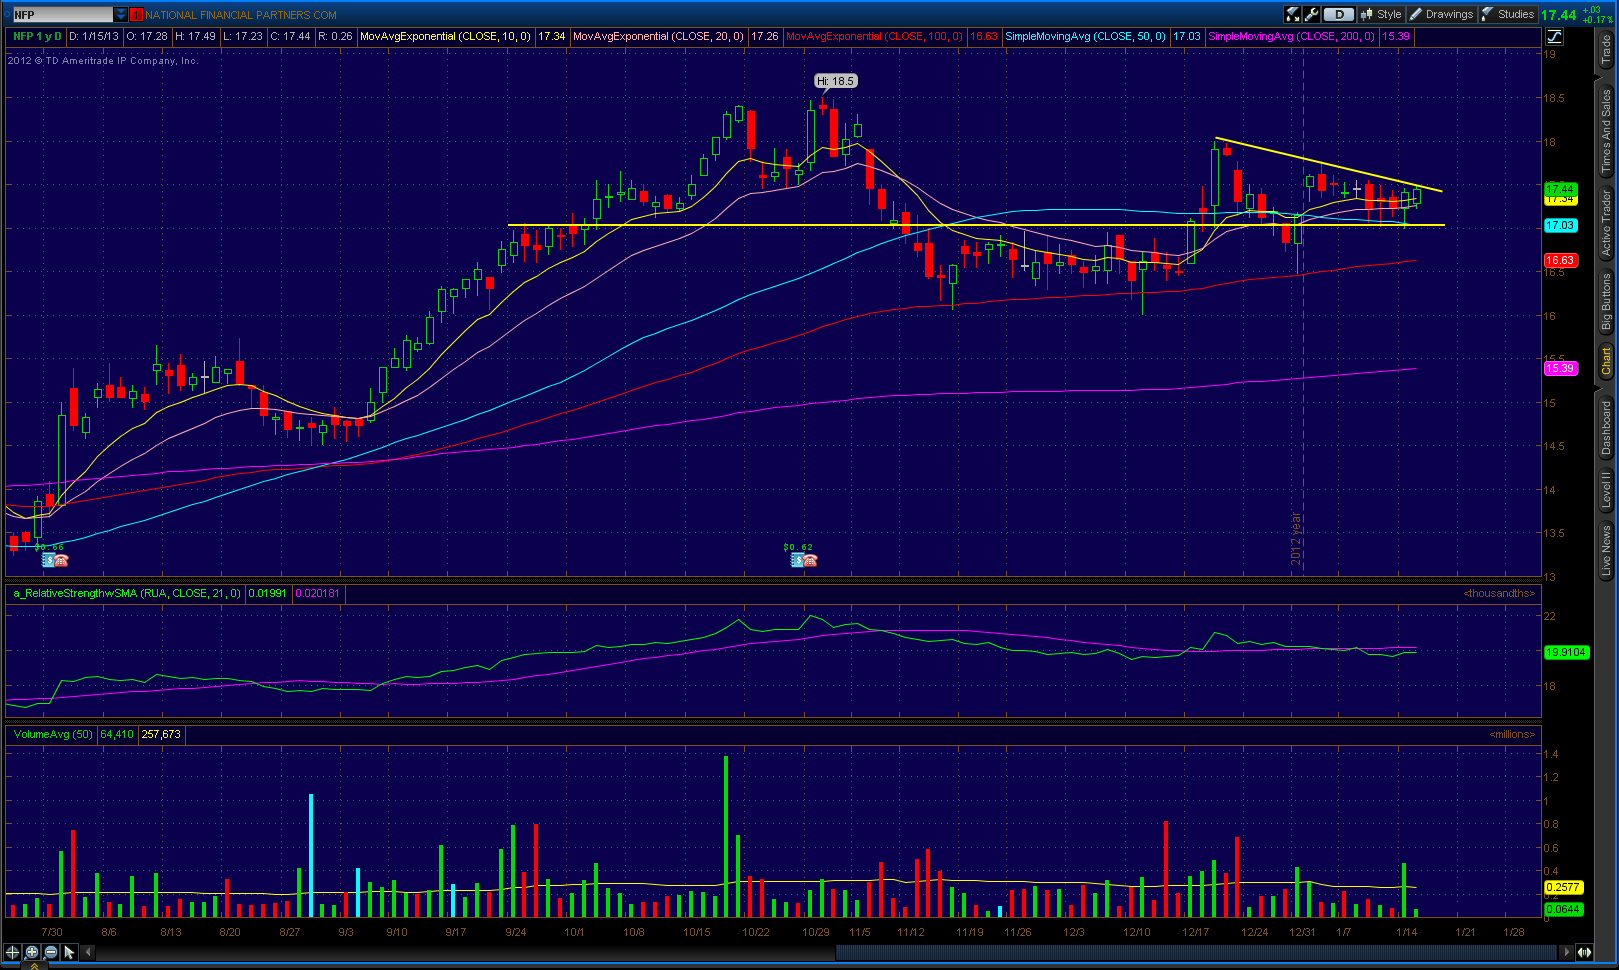
6) NFP – insurance broker, like the pattern w/17 & 50sma support, 12+ days to cover