We started the week off reviewing some bitcoin proxy plays thanks to the bullish bitcoin comments from Square & Twitter CEO Jack Dorsey. One name that popped up in the Exodus trading room as a bitcoin proxy with a good chart was $OSTK.
Technically, the stock was poised for a move higher after the initial break of $16 with volume (See below):
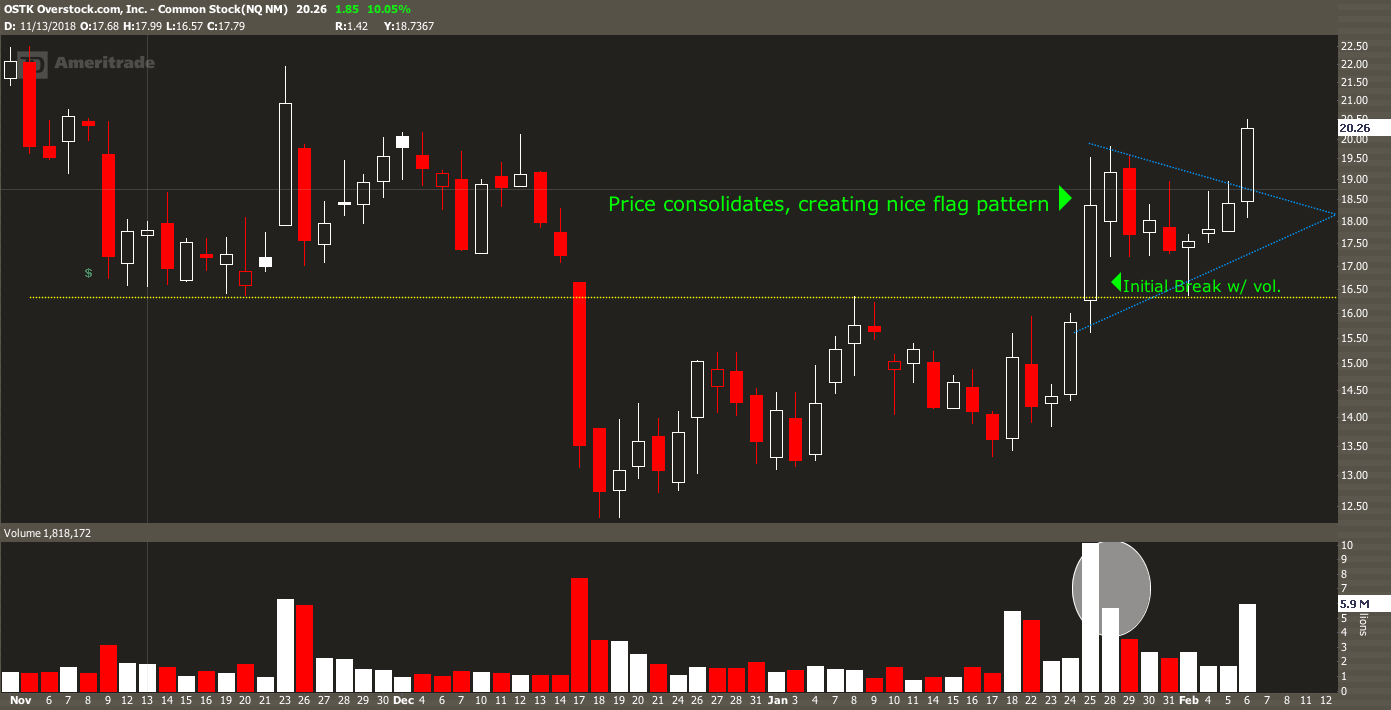
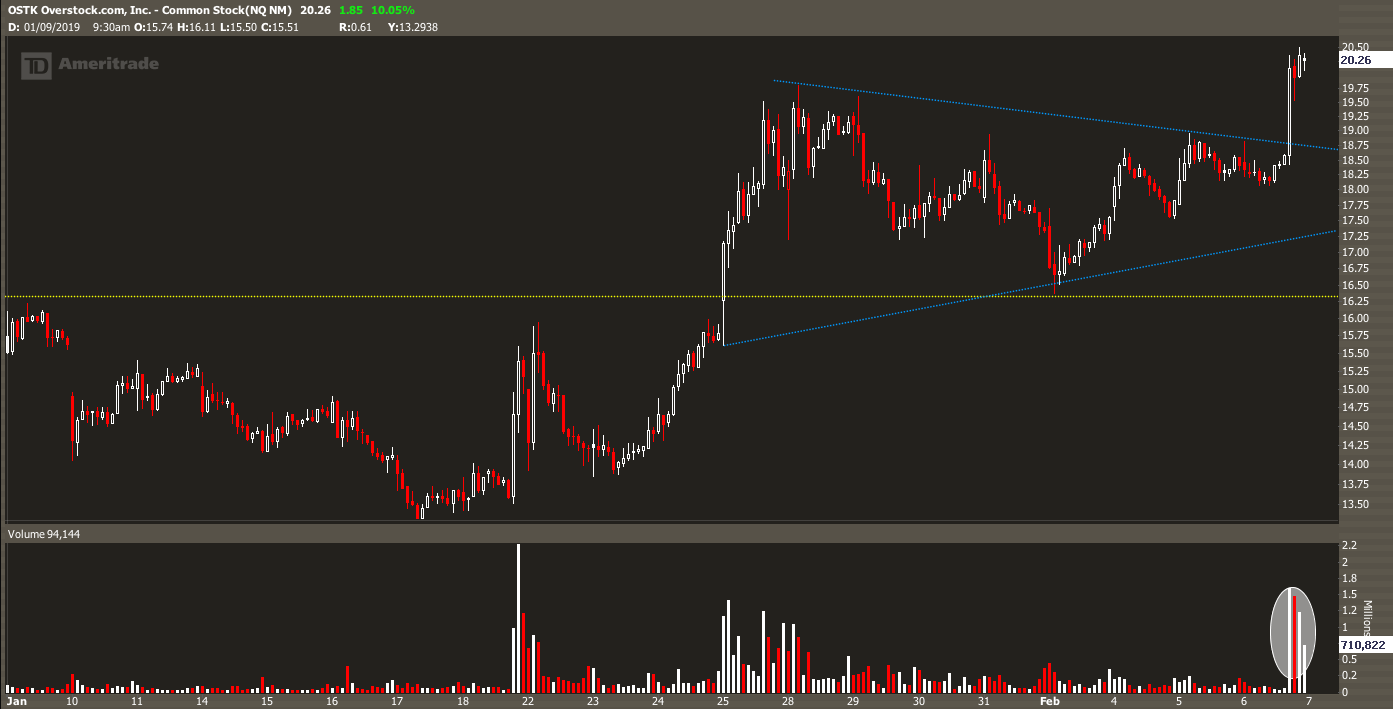
After the initial break, which I missed, all we had to do is wait for the chart to consolidate giving us a few pivot points to draw stupid lines on. We then switch gears to a shorter time frame, I like to use the 30 minute chart as seen below, to really zoom in on our action point. This give us a clear picture of where price should breakout should we get above our silly lines drawn on charts (Crazy, but true).
 _
_
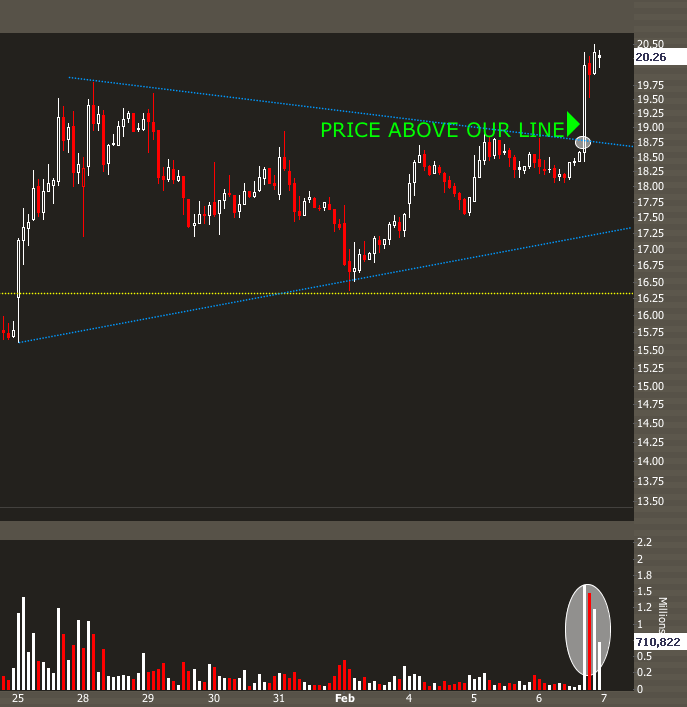
Once the stock traded above 18.70-80, it was off to the races, as many traders keyed in on that level for their entries. See below:
 __
__
In my many years of trading, I always find to be more successful when I have a catalyst or a thesis, which is all supported with a great chart. Those two things can equal much success over your trading career, as well as give you confidence to see the trade through.
$OSTK closed near the highs of the day and we are swinging the stock overnight for a possible 3-5 day hold. If bitcoin starts to move higher expect a major squeeze to develop here. For more info on our trades in real time, entry & exits, be sure to visit the Exodus trading room.
If you enjoy the content at iBankCoin, please follow us on Twitter